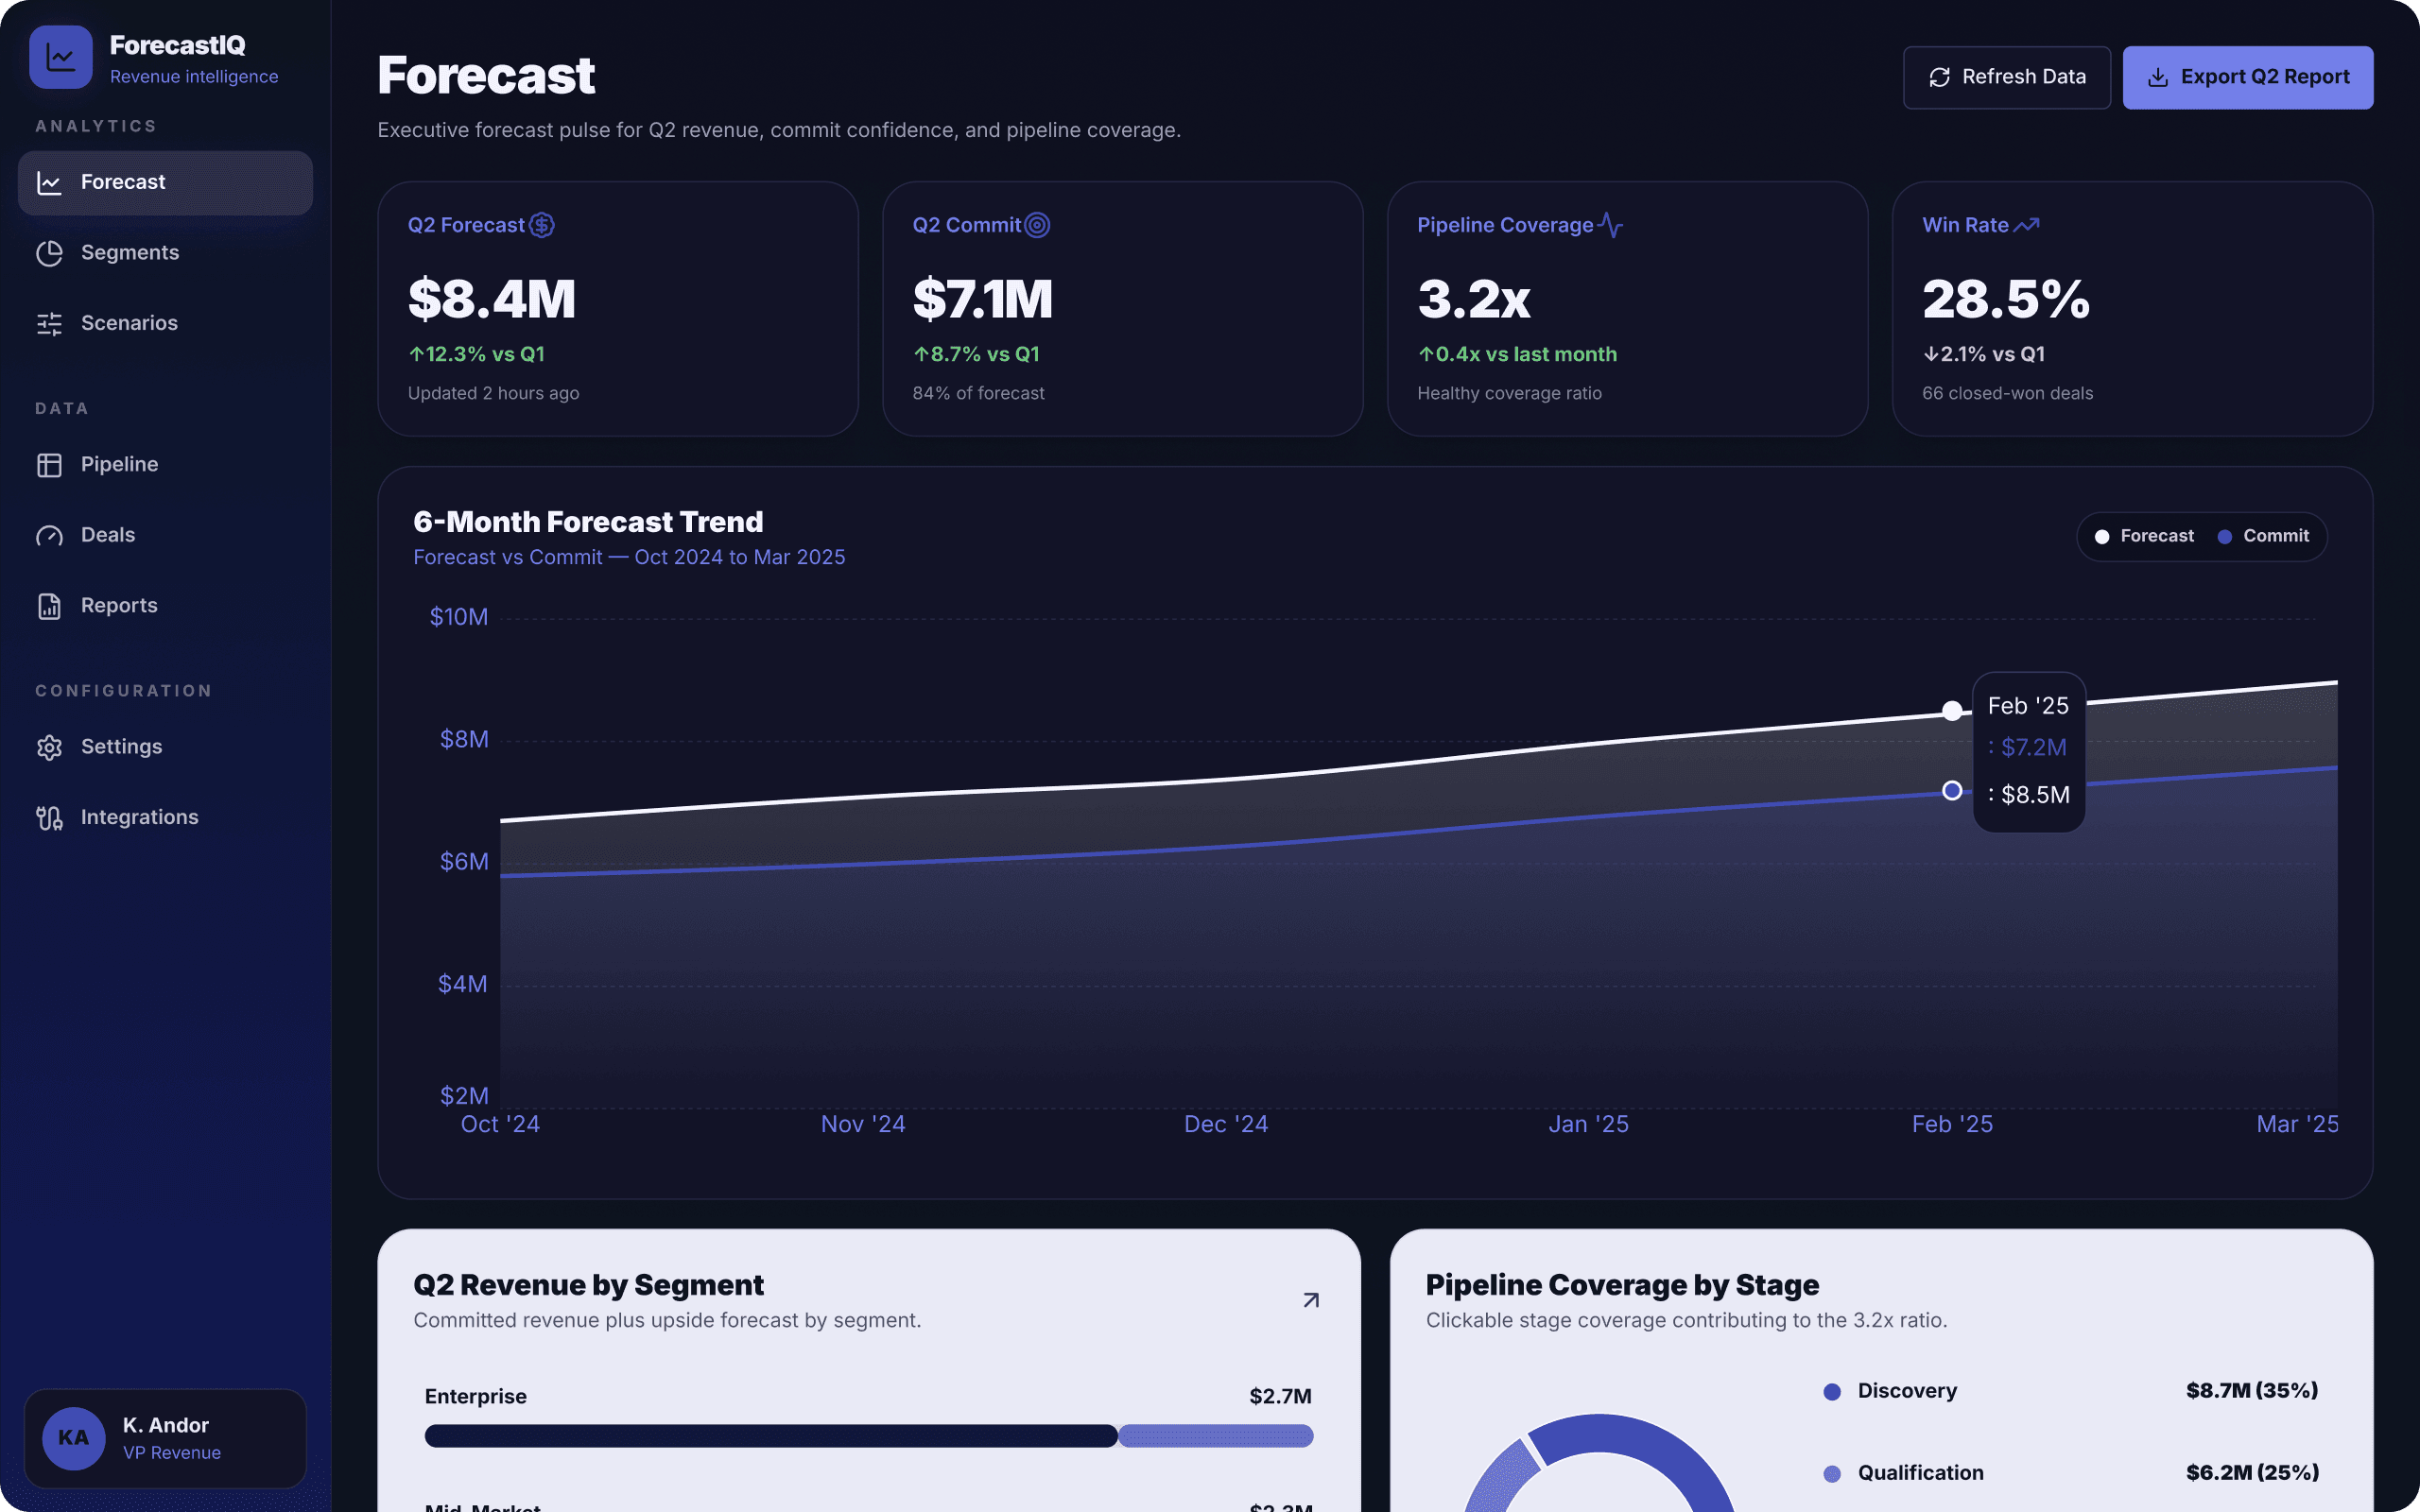
Revenue forecasting dashboard
A revenue forecasting dashboard for sales leadership showing forecast, commit, pipeline coverage, and win rate, each trending against last quarter. Watch forecast and commit diverge across a six-month trend, break the number down by segment, model different scenarios, and drill into the pipeline and deals underneath. Revenue leaders know how much is real, where the risk is, and whether the pipeline can actually cover the target. Built on React, ready to run securely on your data.
Popular integrations


Libraries
React, React Router, Radix UI, Lucide Icons, Recharts, Tailwind, Sonner
Retool CLI
Start from this app in your terminal
Build Retool apps on your own machine, in your editor or with your own coding agent. The CLI handles scaffolding, validation, preview builds, and publishing.
Read the CLI docs1. Install the Retool CLI
pnpm i -g @tryretool/cliUse a different package manager? Retool requires pnpm. Run
npm i -g pnpmfirst.2. Sign in to your Retool org
retool auth login --host .retool.comYour org name is the start of its web address: acme in acme.retool.com.
3. Create your own copy of this app
retool init forecast-iq --gallery forecast-iq
Rapidly develop with pre-made apps
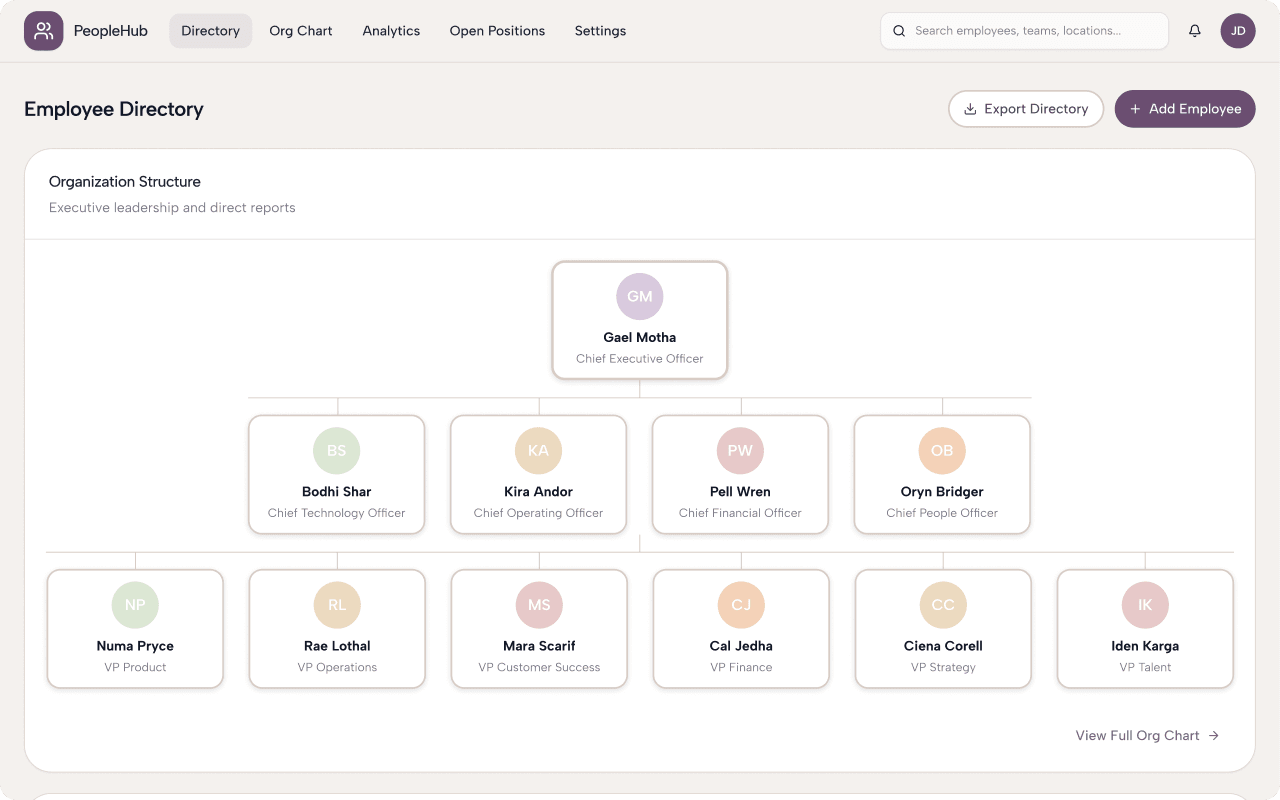
Employee directory app
A people directory for HR, built around a searchable employee directory and a visual org chart that maps every member of your team. Search by employee, team, or location, see reporting lines at a glance, track open positions, and pull people analytics when you need the bigger picture. Help HR keep structure, headcount, and open roles in one place instead of a stale org-chart slide. Built on React, ready to run securely on your data.
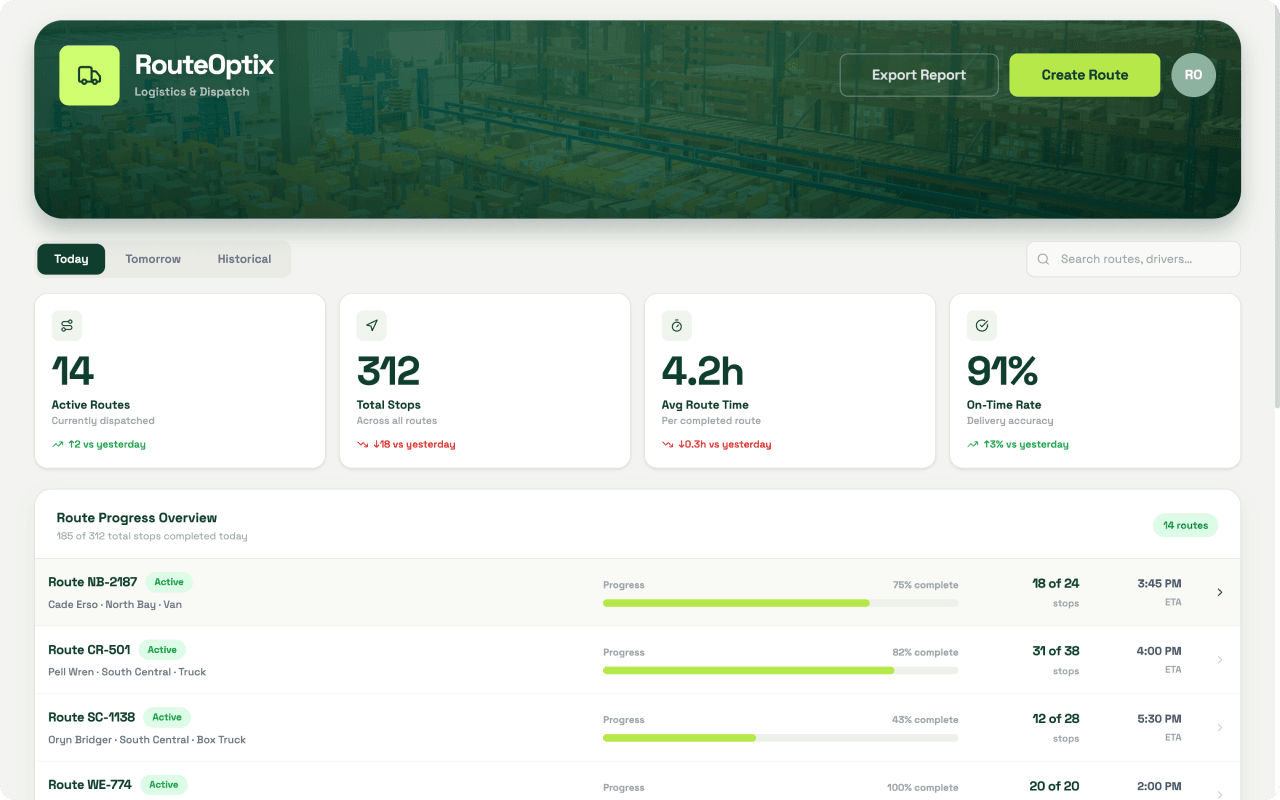
Logistics dispatch monitor
A logistics dispatch console, built around a live view of the day's routes—active routes, total stops, average route time, and on-time rate, all trending against yesterday. Track each route's progress by driver, region, and vehicle, watch stops complete against their ETAs, and flip between today, tomorrow, and historical runs. Built on React, ready to run securely on your data.