ARR Dashboard
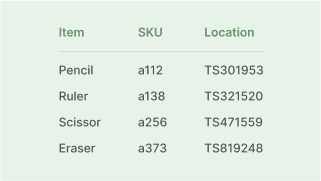
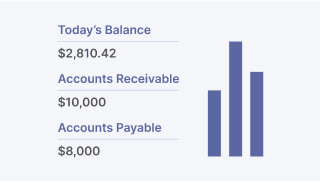
This app provides an interactive dashboard to visualize and analyze datasets, with each row representing an individual data object.
How it works
Retool generates production-ready AI apps. You can start with a prompt, then connect to real databases and APIs, apply enterprise security, and deploy in your cloud.
Learn more about Retool AI app building- Click the "Generate this app in Retool" button above to start building with a prompt
- Retool generates an app you can actually operate, not just a demo: UI, logic, and editable components
- Connect securely to your databases, third-party services, and any REST or GraphQL API
- Ship with enterprise controls: SSO, role-based access, approvals, and audit logging
- Deploy and iterate over time in Retool Cloud or your own VPC
Build Dashboard apps with AI
Build Data and Analytics apps with AI
Build other apps with AI
Customers using Retool like this
View customer stories“Retool has been critical for our ops from the start, and is the reason we’re able to scale so quickly. Anything operations or sales wants is built instantly in Retool, instead of in weeks with actual code. And the on-prem version with access controls + audit logs makes it easy to meet our compliance requirements.
Retool has been critical for our ops from the start, and is the reason we’re able to scale so quickly. Anything operations or sales wants is built instantly in Retool, instead of in weeks with actual code. And the on-prem version with access controls + audit logs makes it easy to meet our compliance requirements.
Henrique Dubugras
CEO at Brex
“What I love about Retool is that the biggest limitation is your imagination. I still feel like I’m only using 20 percent of what Retool is capable of.
What I love about Retool is that the biggest limitation is your imagination. I still feel like I’m only using 20 percent of what Retool is capable of.
Amo Moloko
Software Engineer at Tripplo
Frequently Asked Questions
Retool is a development platform that allows developers to quickly build custom internal tools and dashboards for their businesses. Retool offers a drag-and-drop interface and pre-built components, making it easy to create applications while writing little code.
Retool is used by a variety of businesses, from small startups to large enterprises, across industries such as healthcare, finance, and e-commerce. Retool is particularly useful for businesses that rely heavily on internal tools and dashboards to run their operations, as it allows for the creation of custom applications tailored to their specific needs.
Retool supports a wide range of databases, including MySQL, PostgreSQL, Microsoft SQL Server, Amazon Redshift, and Google BigQuery. Retool also offers integrations with popular APIs and services such as Stripe, Twilio, and Slack, making it easy to incorporate data from these sources into Retool applications. Here is a list of all our different integrations.
Supercharge your business today.
Start building an internal tool or customer portal in under 10 minutes.