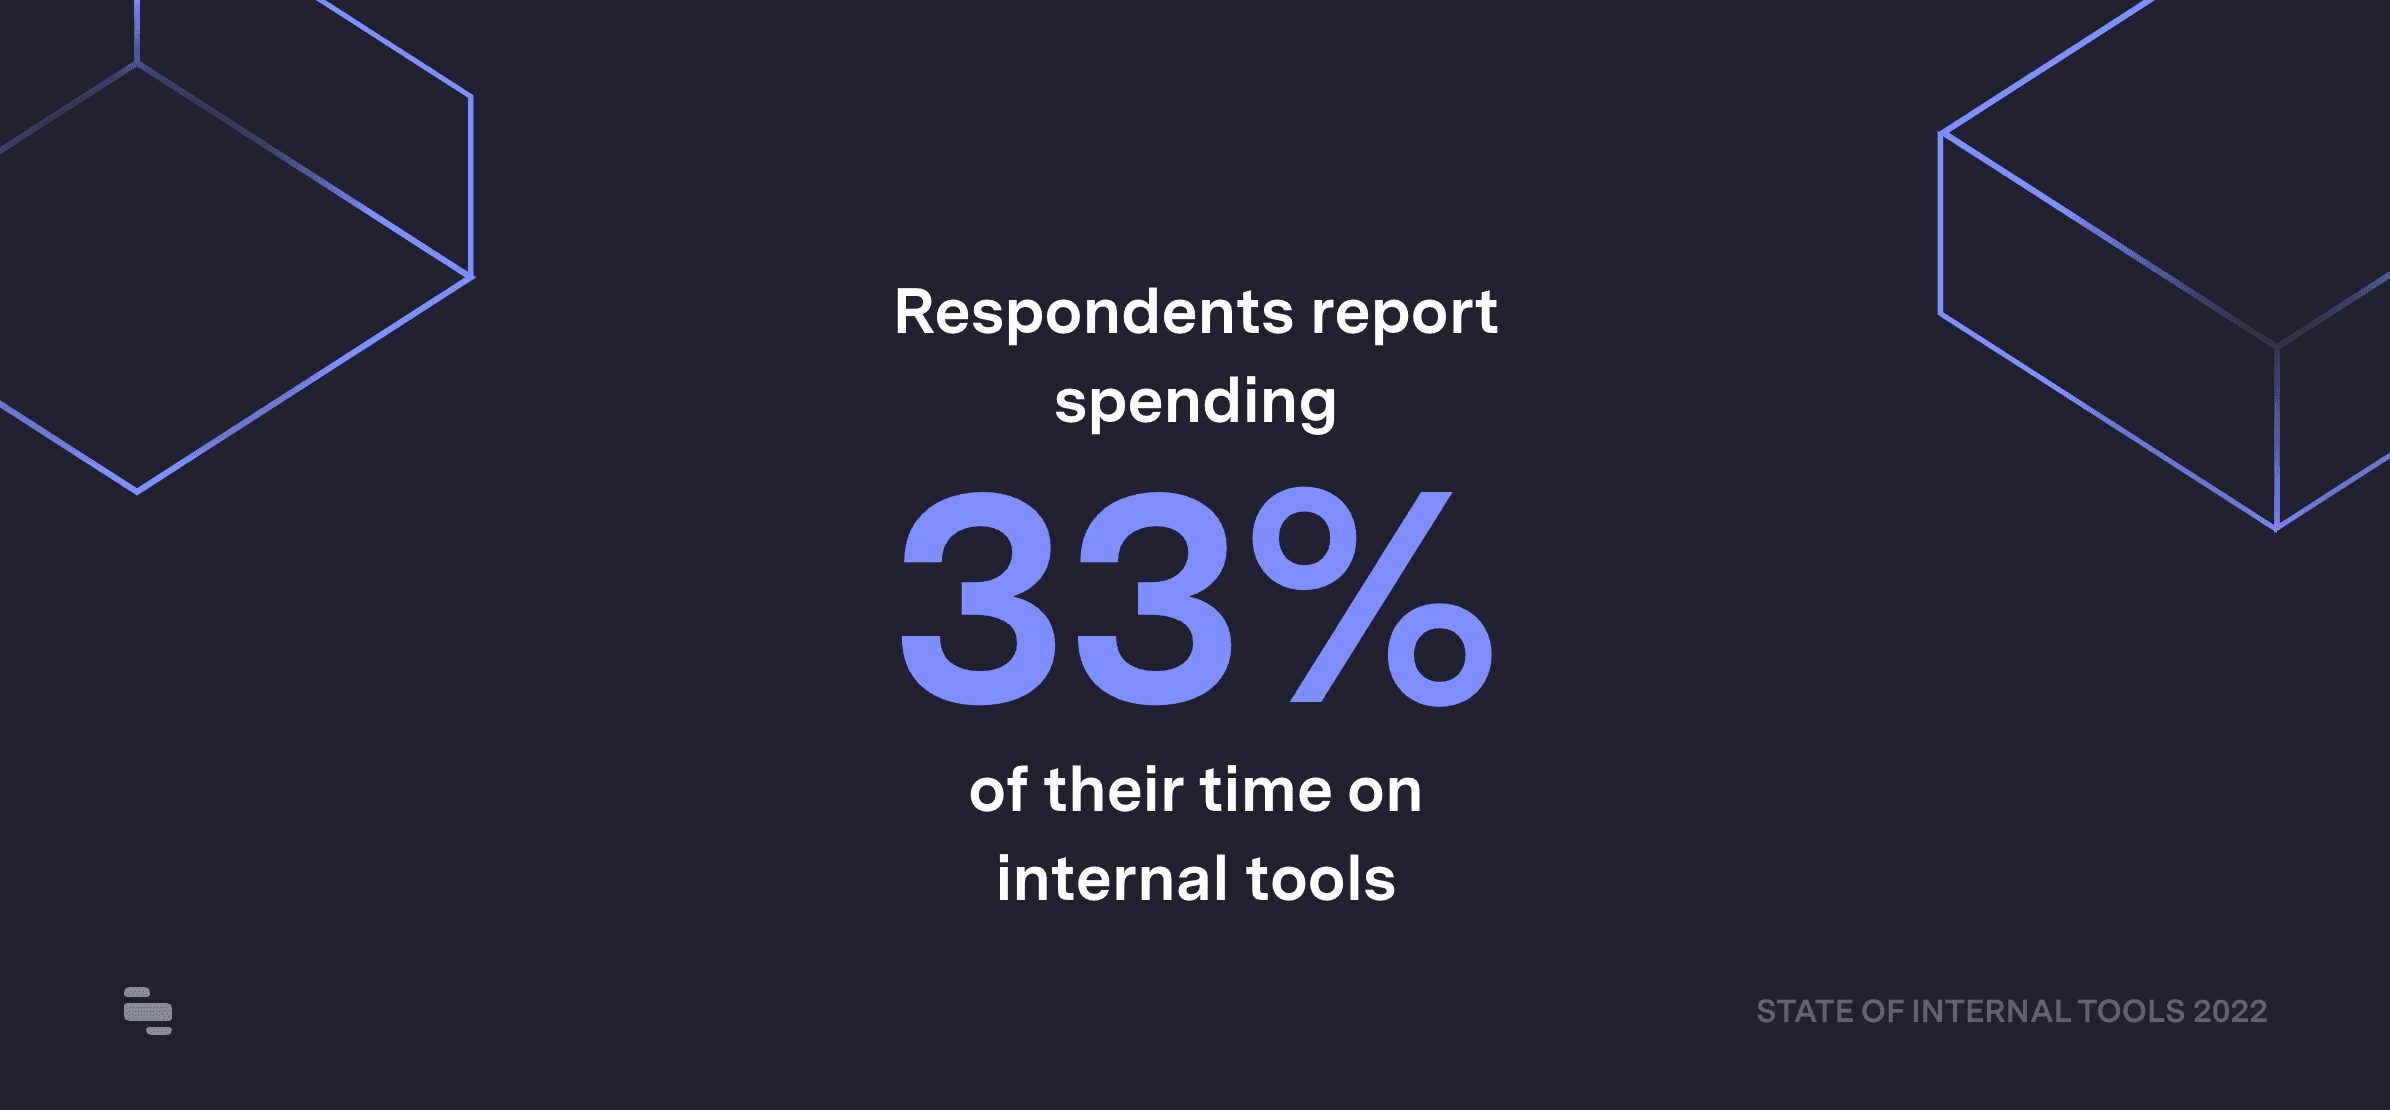
On average, respondents spend 33% of their time building internal tools. This does include a lot of Retool customers but, even so, it's surprising so many engineers spend a third of their time building and maintaining internal tools.
When you break it down by company size, an interesting trend emerges — respondents at larger companies are spending more time and writing more code for internal use cases.
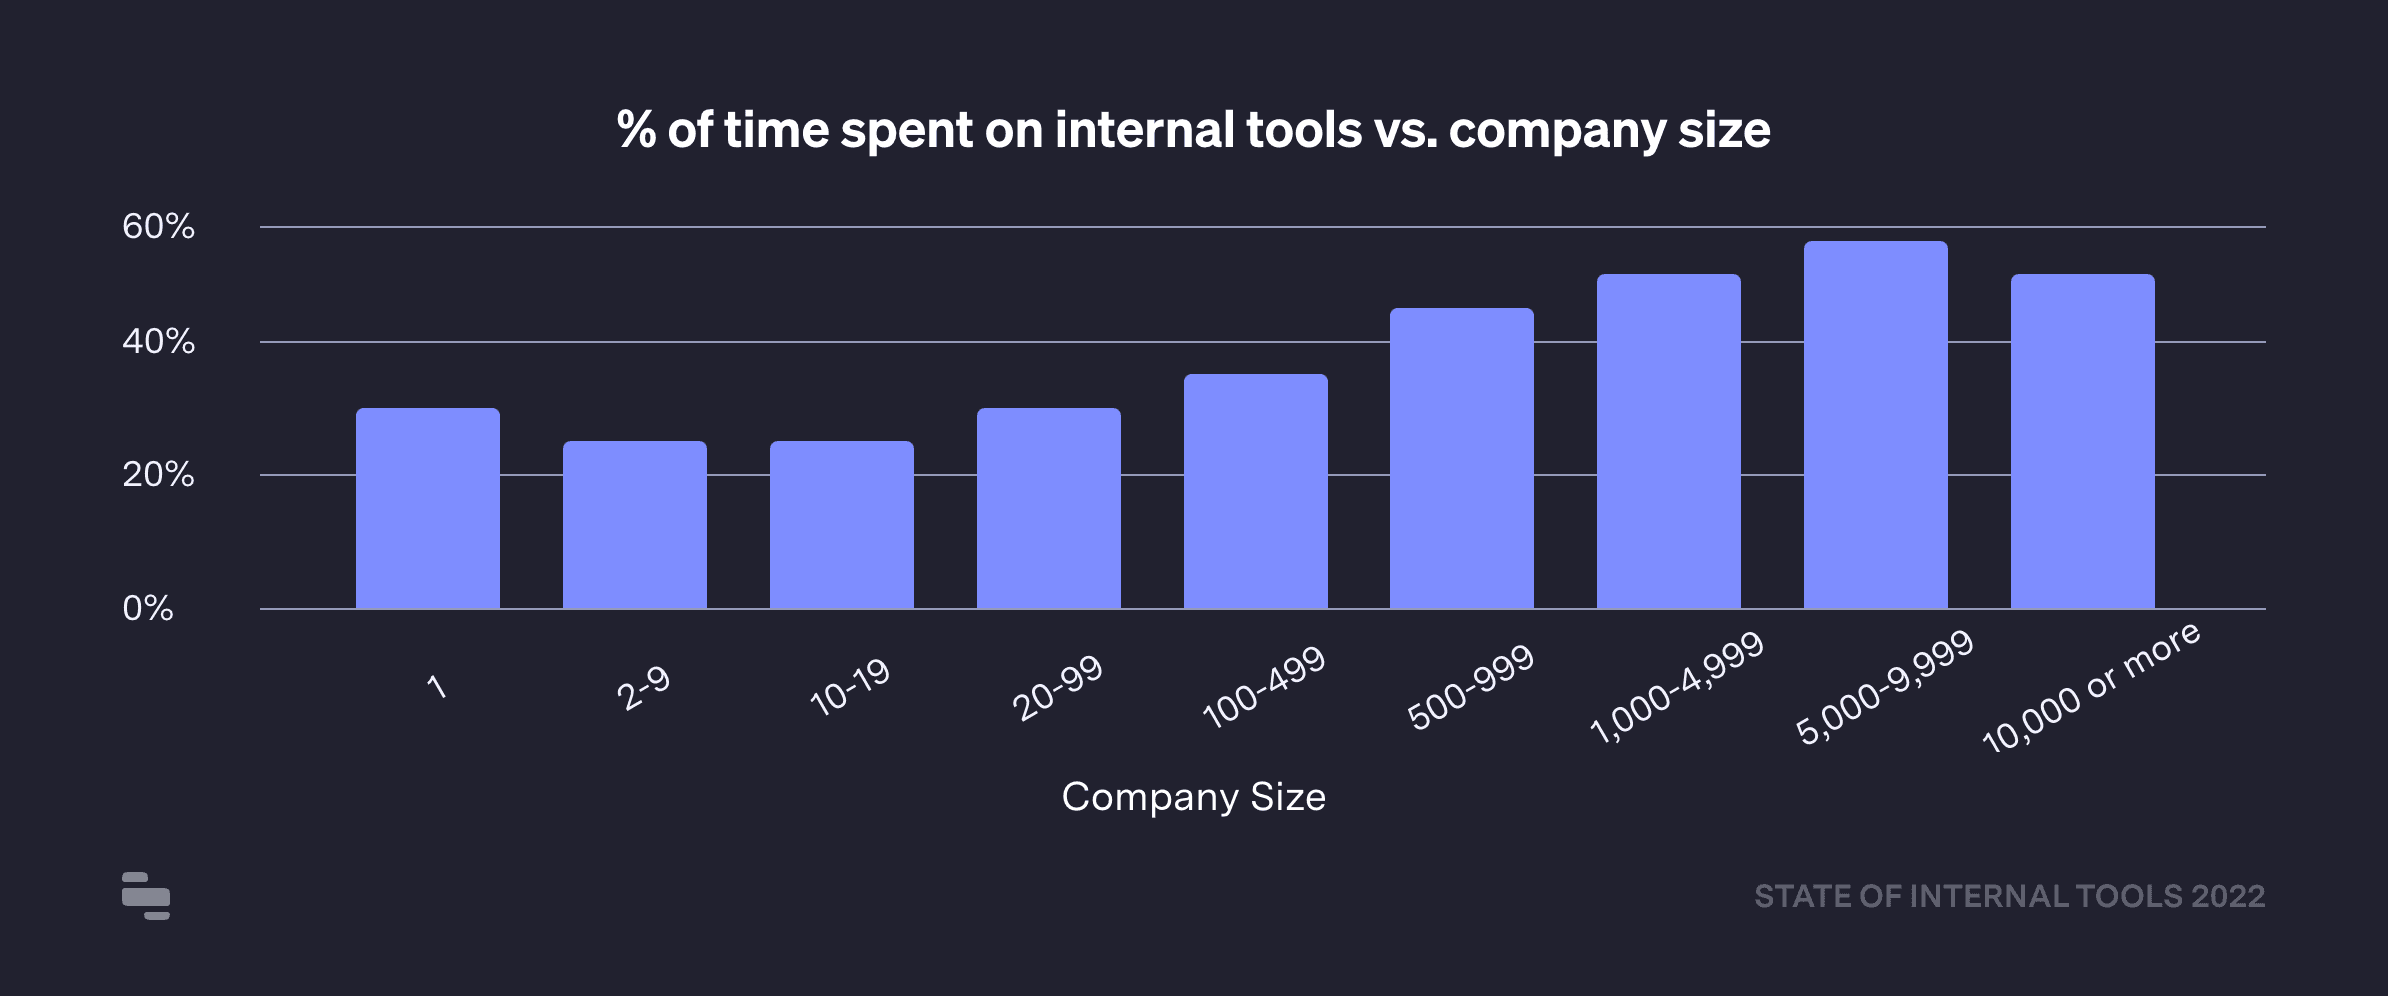
Solo founders report spending over a third of their time on internal tools — most likely on resources that fill in early company and product gaps. But as companies grow, the data suggest that time spent on internal tools increases … to a point.
Once a company reaches 10,000+ employees, time spent on internal tools slightly drops. This follows an existing trend from last year's survey, and might suggest that mature teams are able to codify more of their processes and, perhaps, share the responsibility of internal tooling across the business.
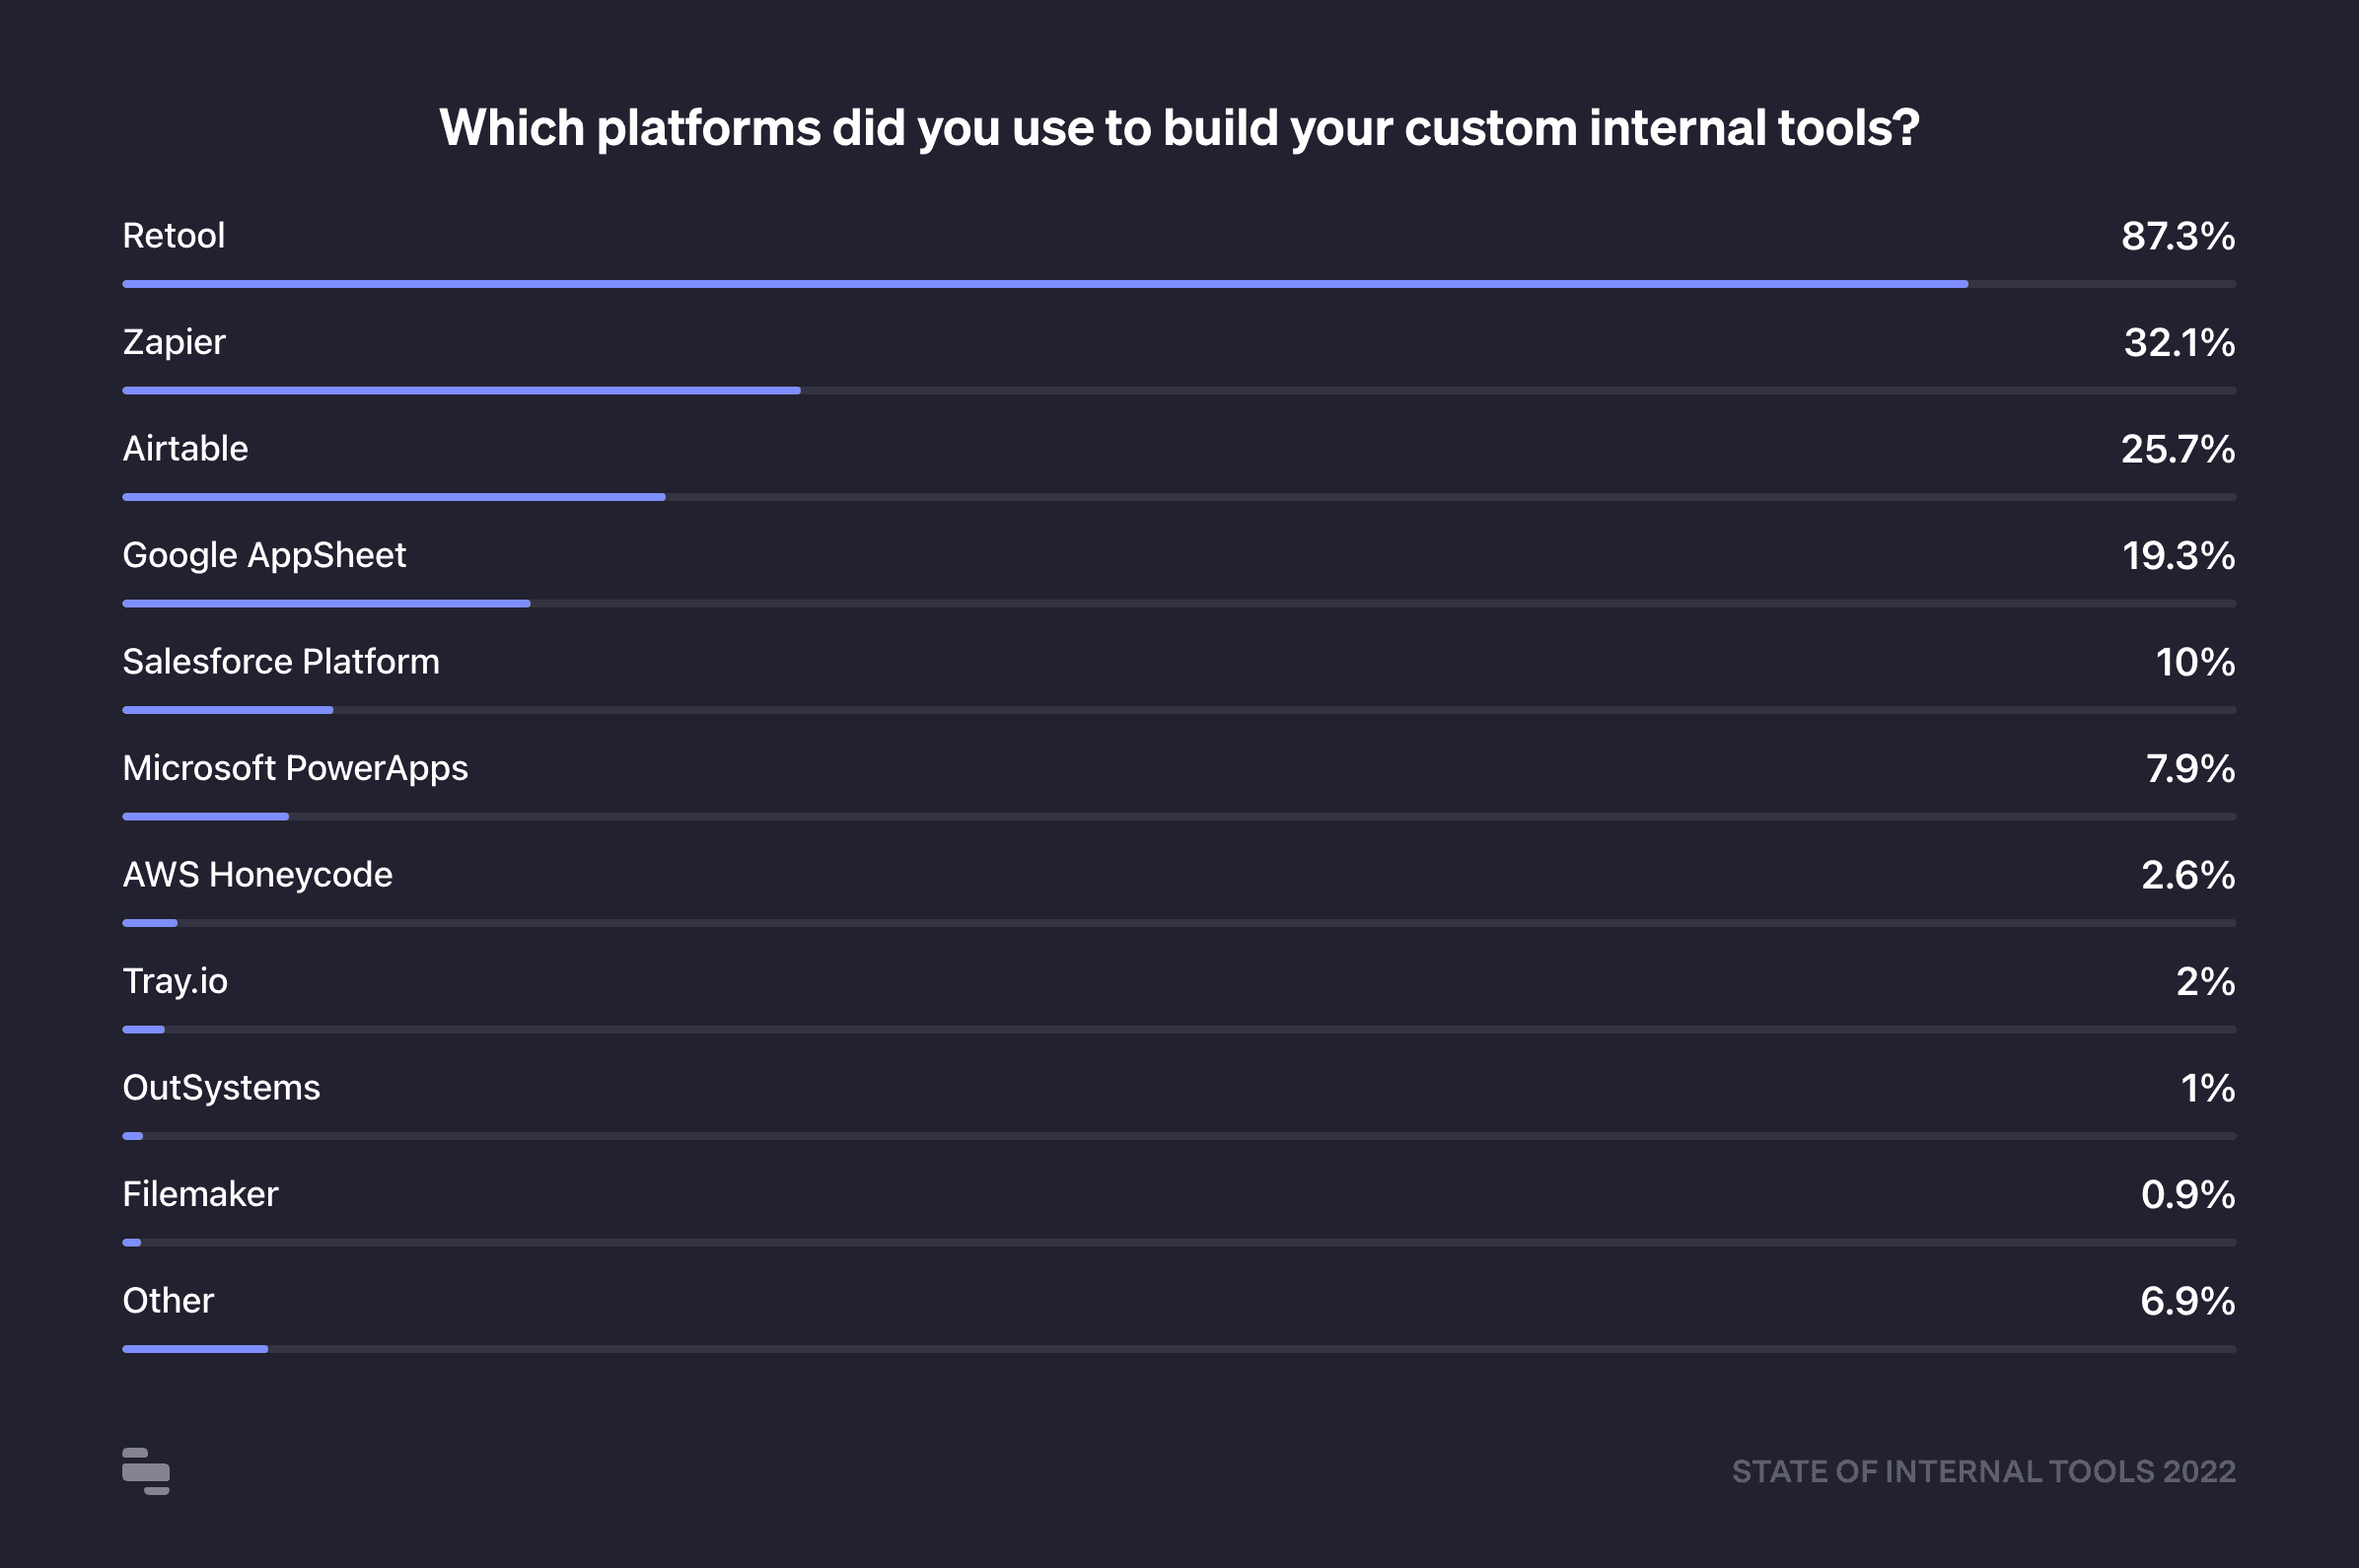
By definition, every company's internal tools stack is unique. We asked respondents which tools they use to automate processes, build custom apps, and generally solve business problems with custom tools. It's no surprise given the makeup of the sample group that Retool is on top, but the survey results suggest that teams use both platforms to build fully custom apps, as well as augment with automation and workflow tools like Zapier (32%), and Airtable (25%).
BI and visualization tools are also popular, with 27% of respondents using them beyond the normal analytics use cases. Tableau is the most used (39%), followed by Microsoft PowerBI (27%), and Google Data Studio / Looker (25% each).
Out of the half of respondents who said they build internal tools from scratch, 57% are using React as their UI framework of choice. JQuery is still prevalent (21%), followed by Angular (12%), which is still a bit ahead of Vue (11%).
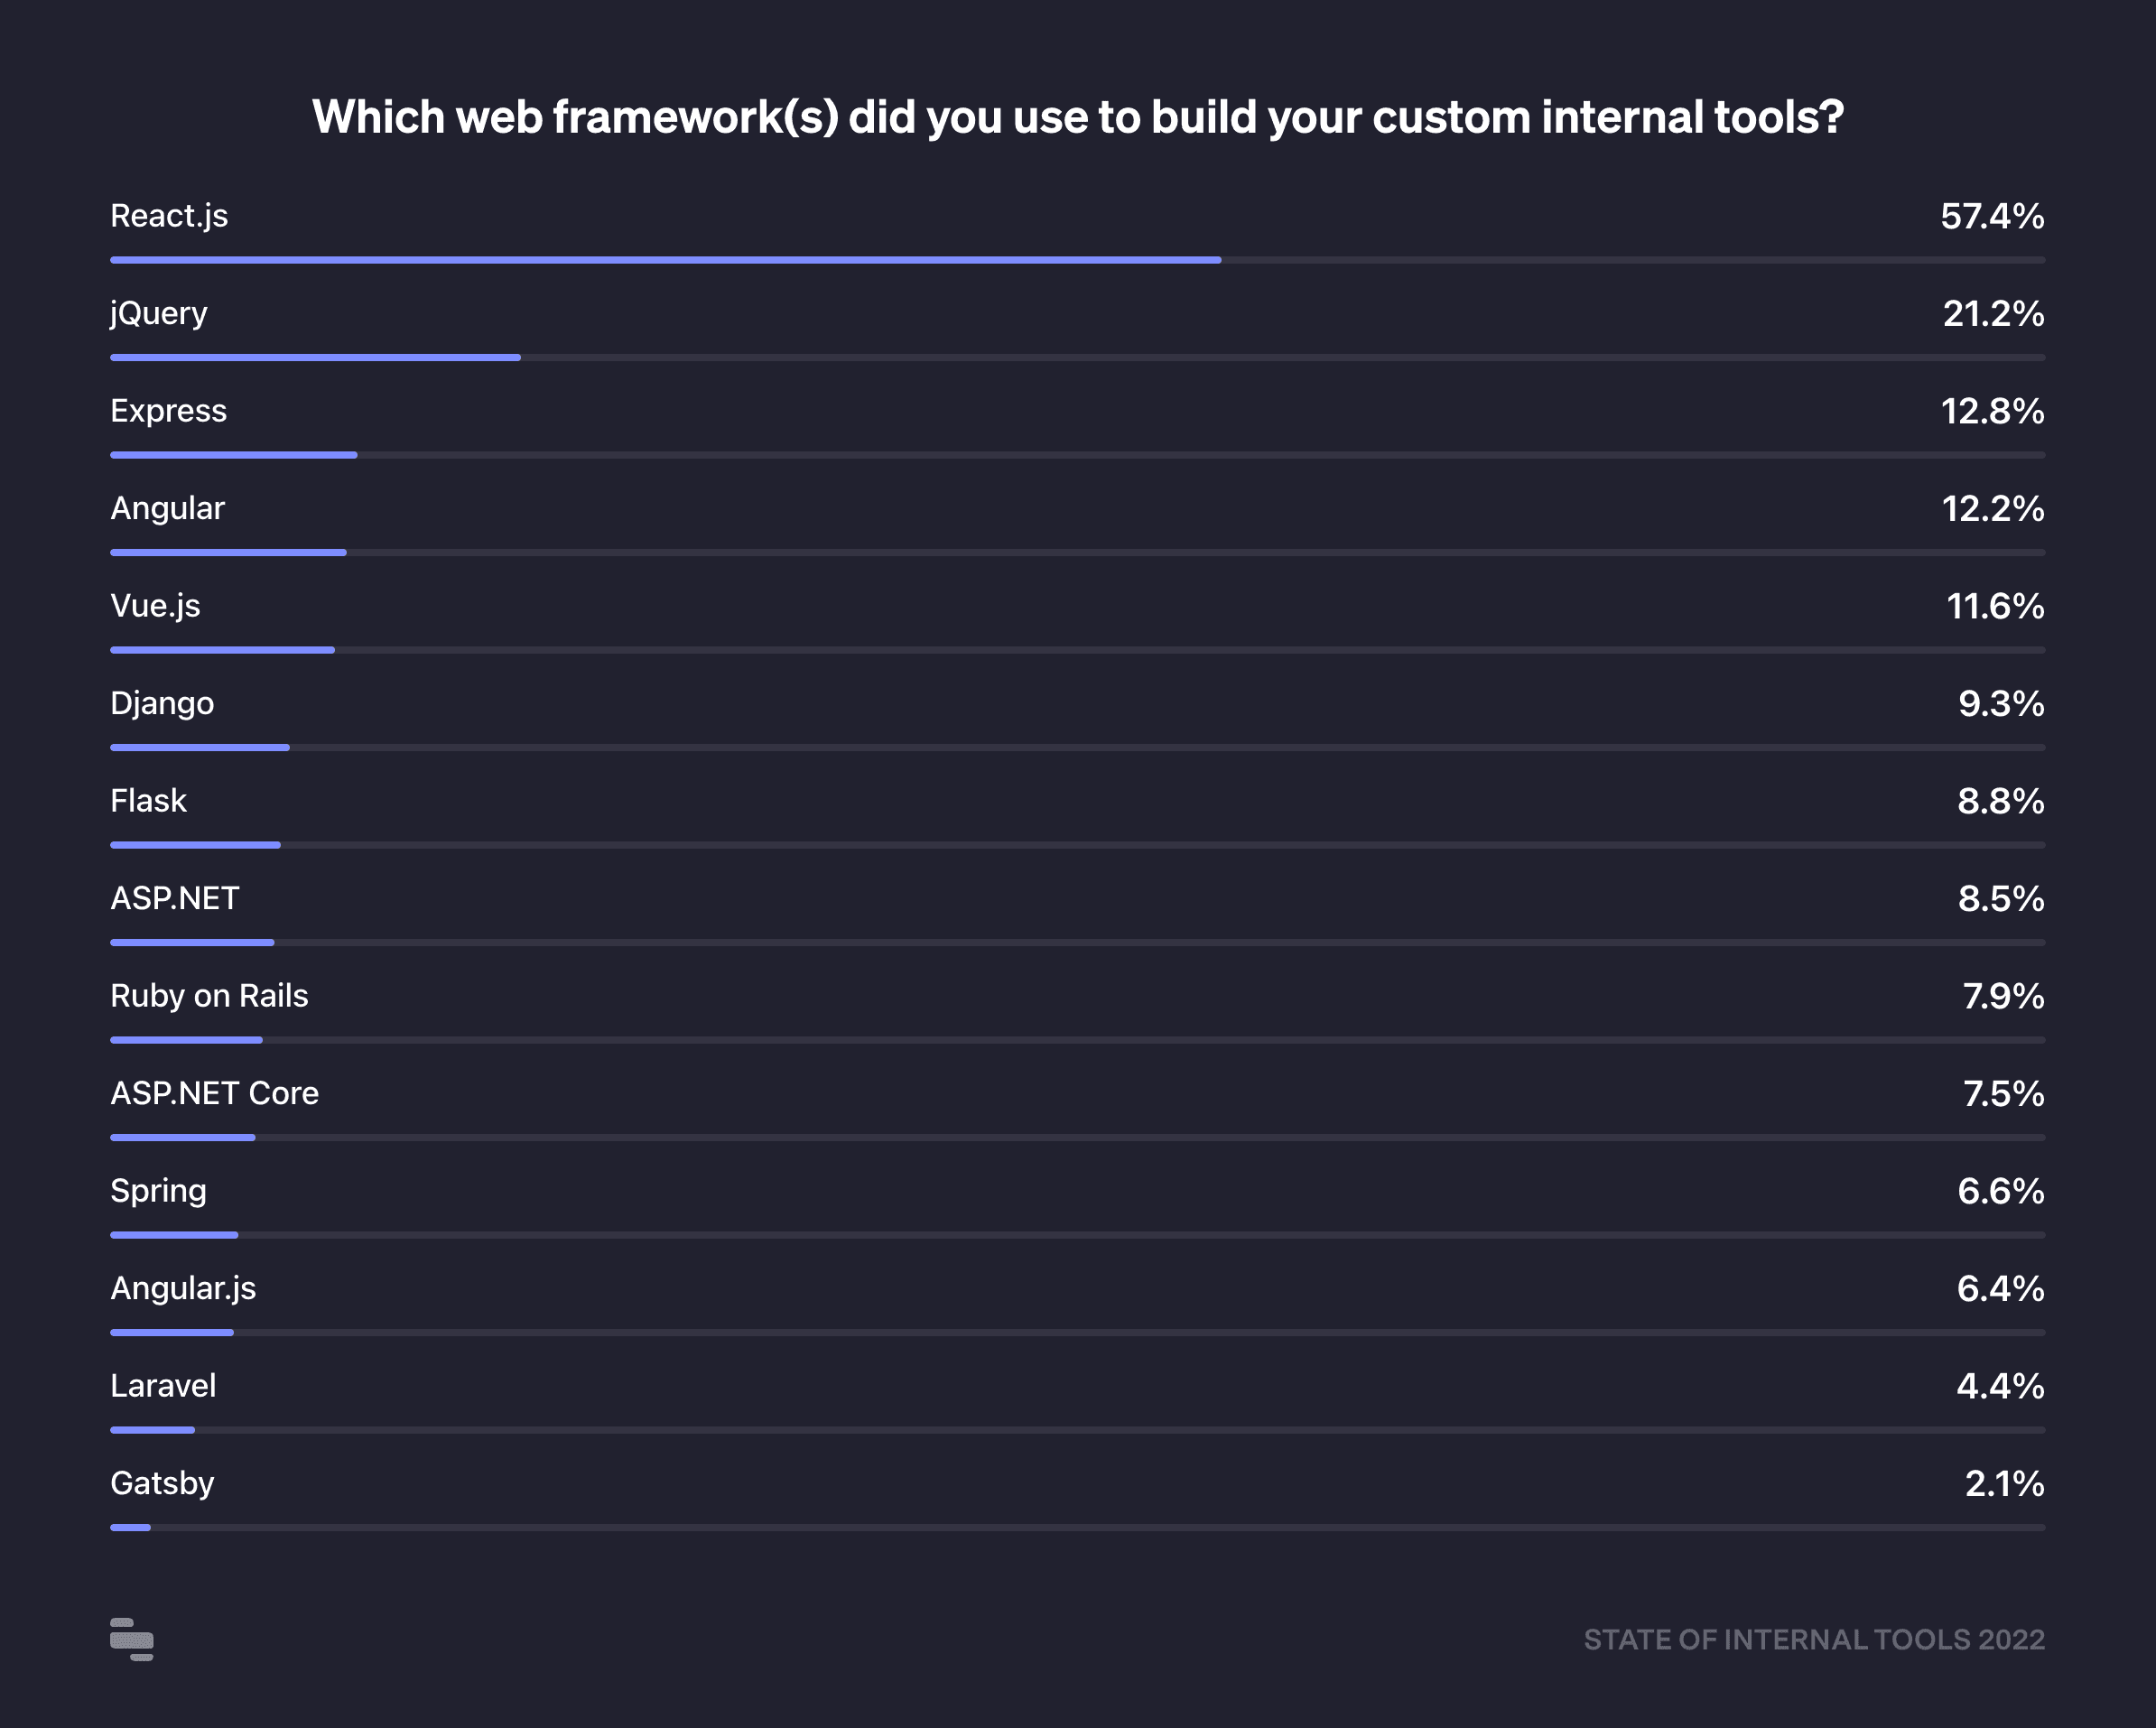
13% of developers said they're using an admin-specific framework for their internal tools. Django Admin is still the most popular by far (51%), followed by Active Admin (15%) and Rails Admin (also 15%). We've already seen that JavaScript and React are much more common than Python and Ruby (+Rails) despite the fact that there is no dominant admin framework for JS / React outside of.
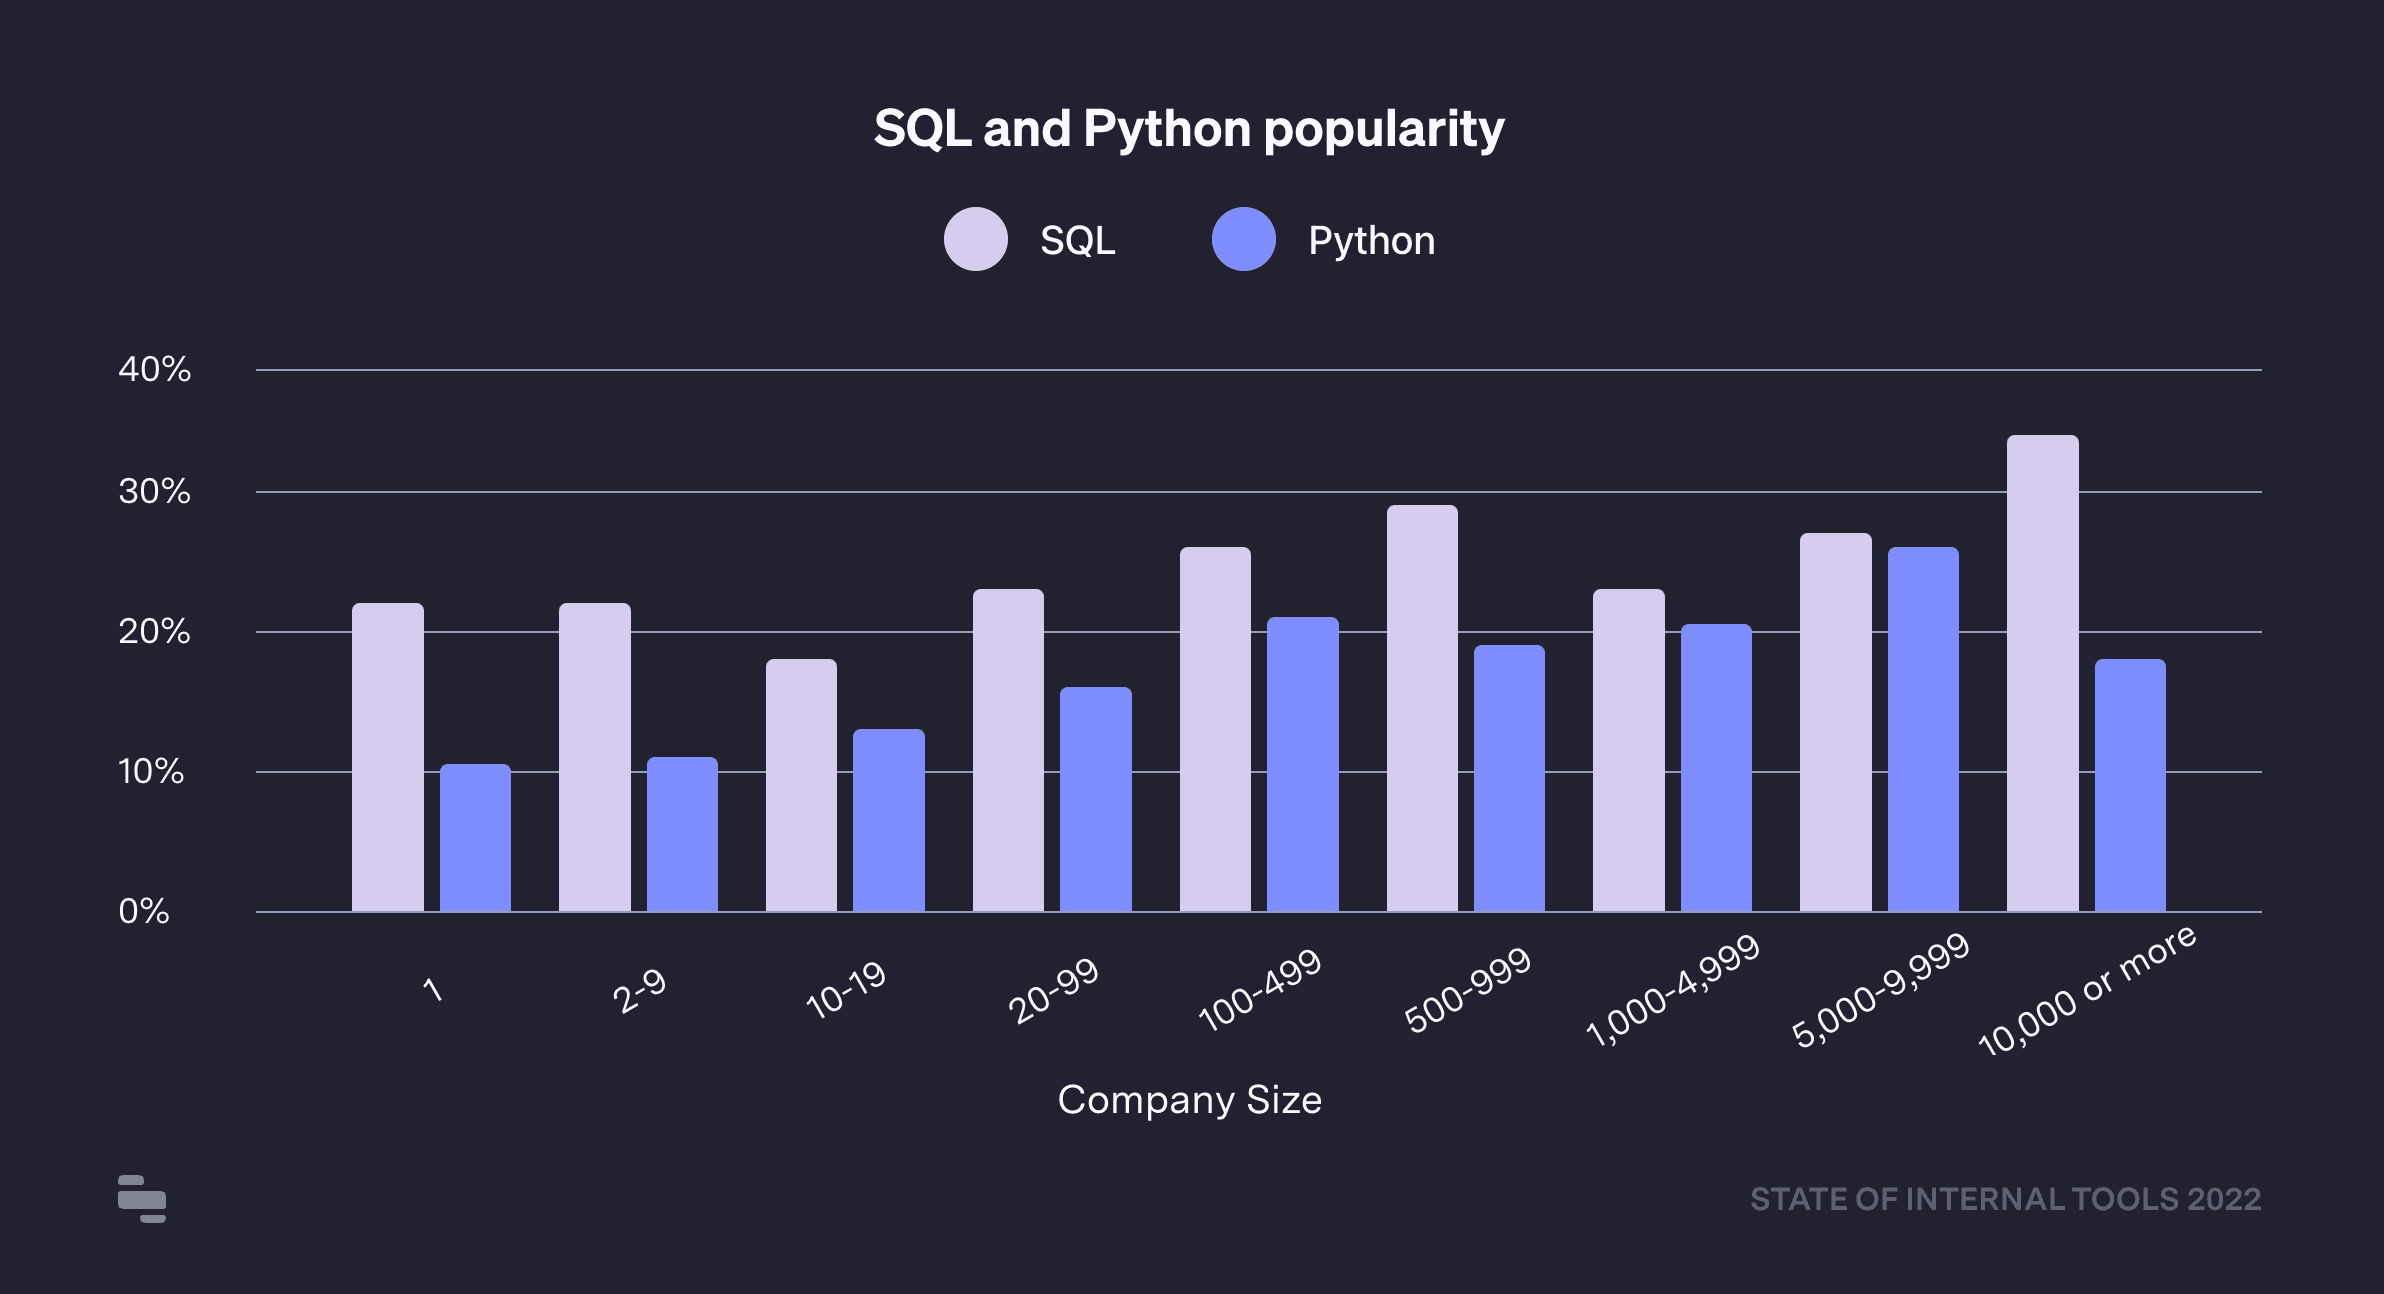
As companies get larger, the mix of languages and frameworks they use for internal tools changes. SQL and Python are good examples: take a look at how they both become steadily more popular as companies grow (the one caveat being Python and companies over 10,000 employees).
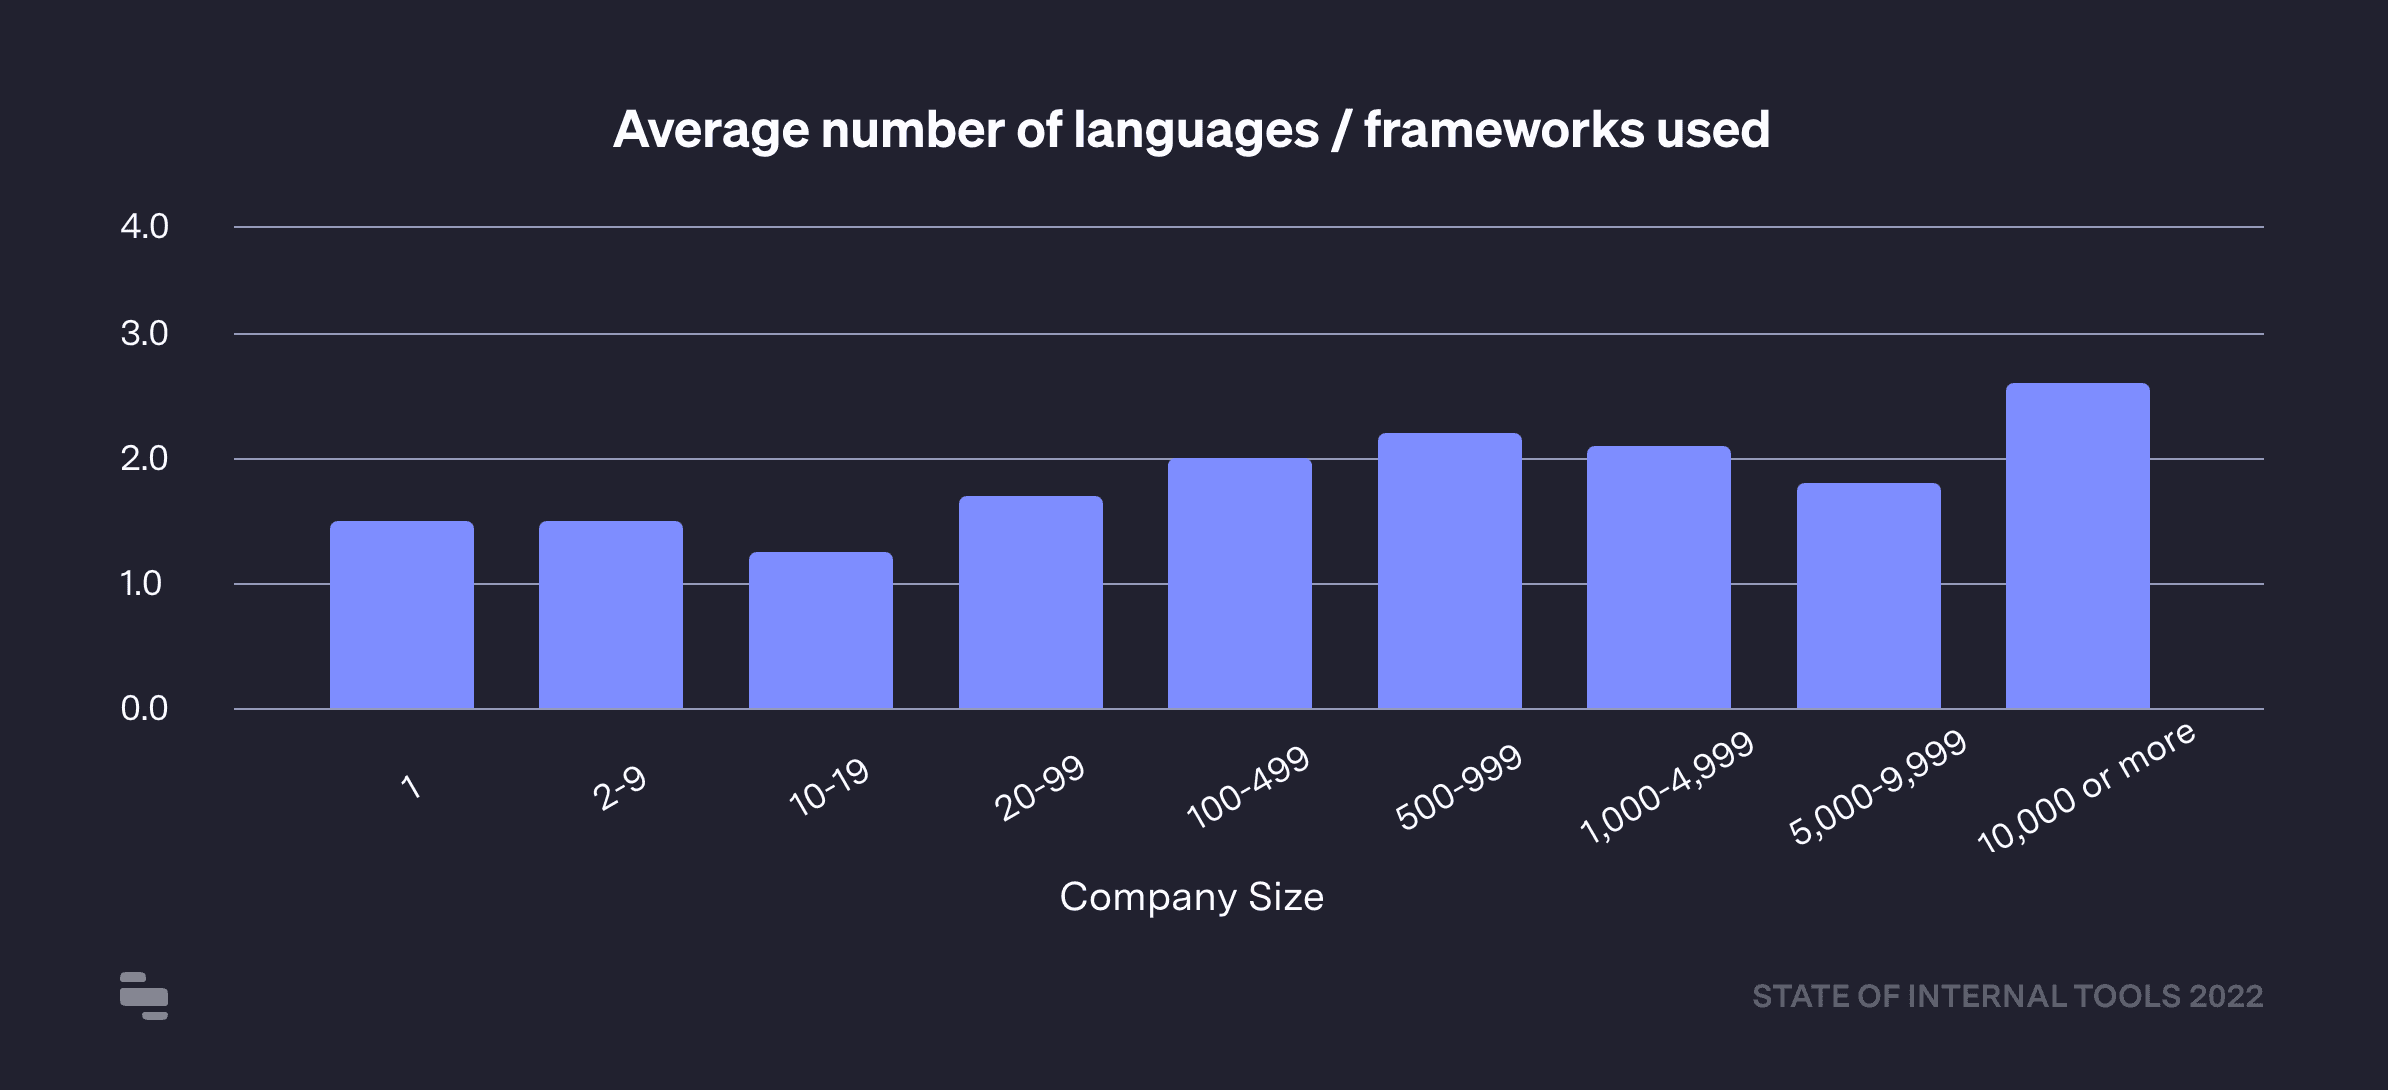
Of course, larger companies use more languages and frameworks in general:
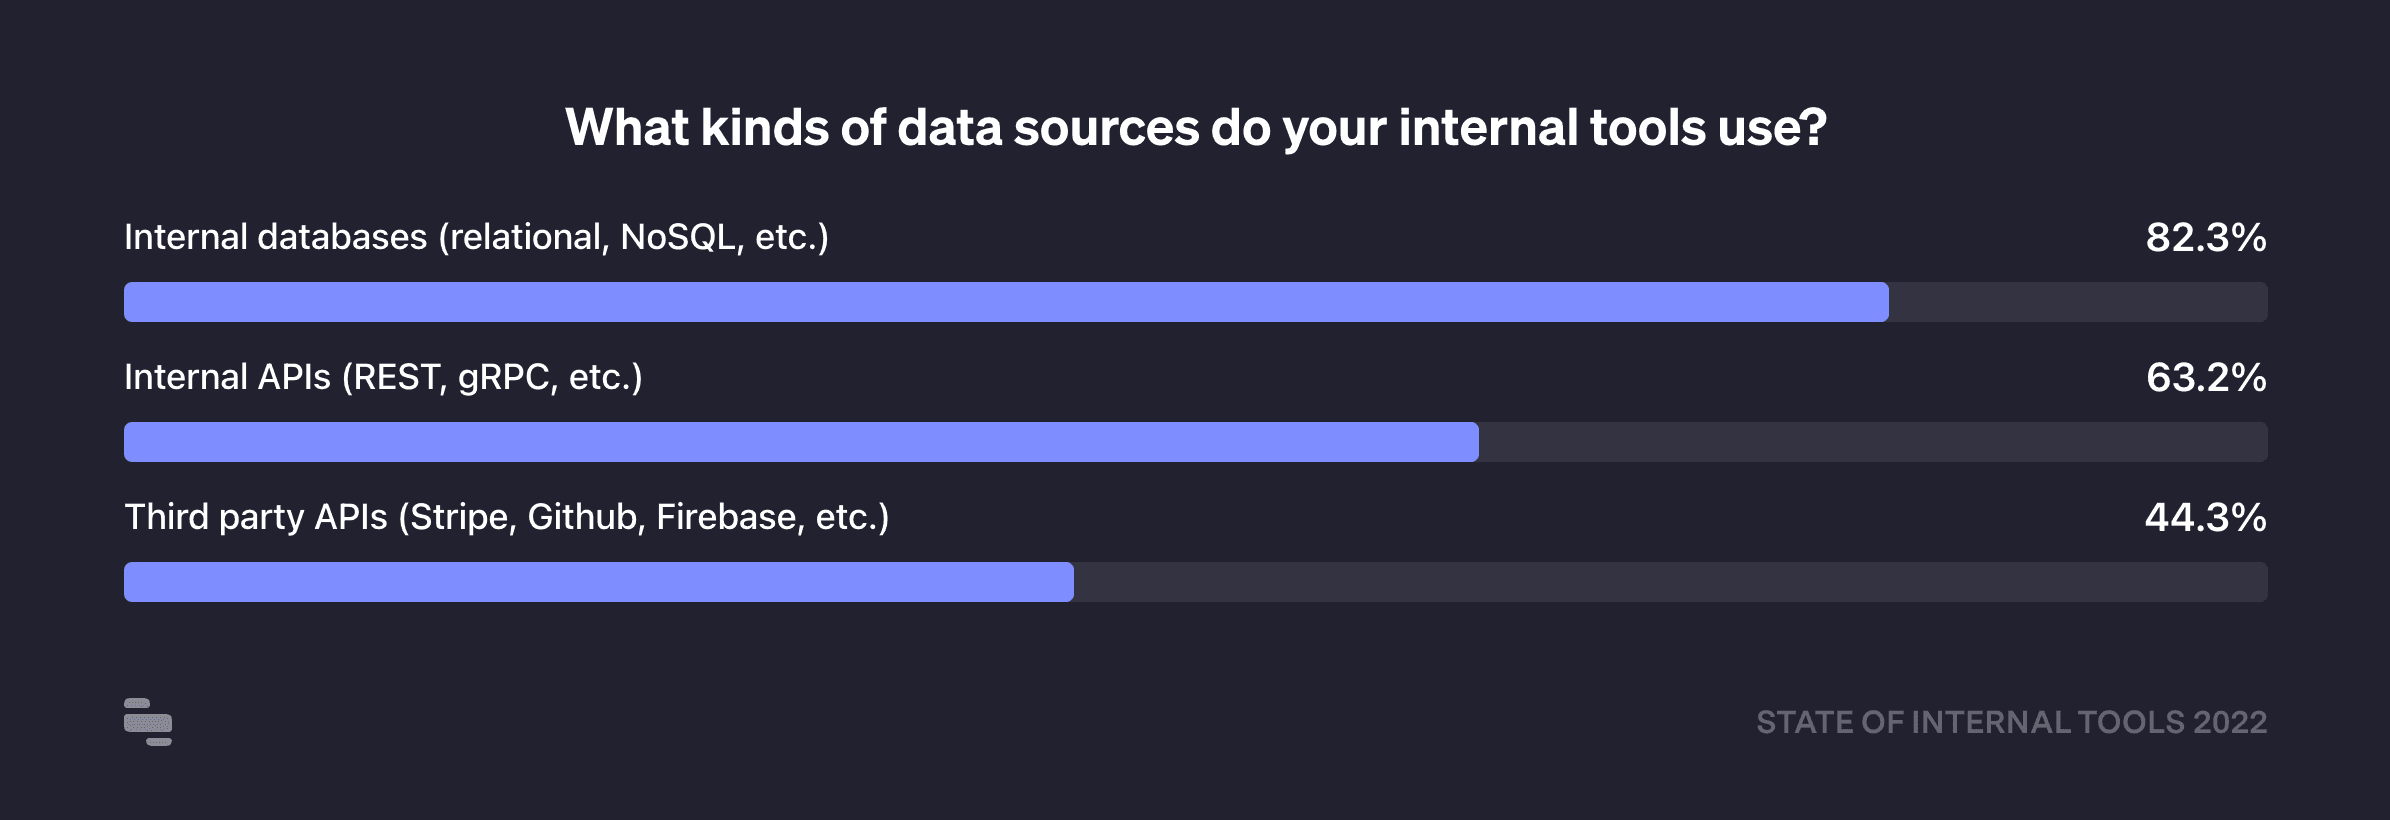
82% of respondents build their internal tools directly on top of databases (production or otherwise), 63% report using internal APIs (REST, gRPC, etc.), and 44% use third party APIs like Stripe, GitHub, etc.
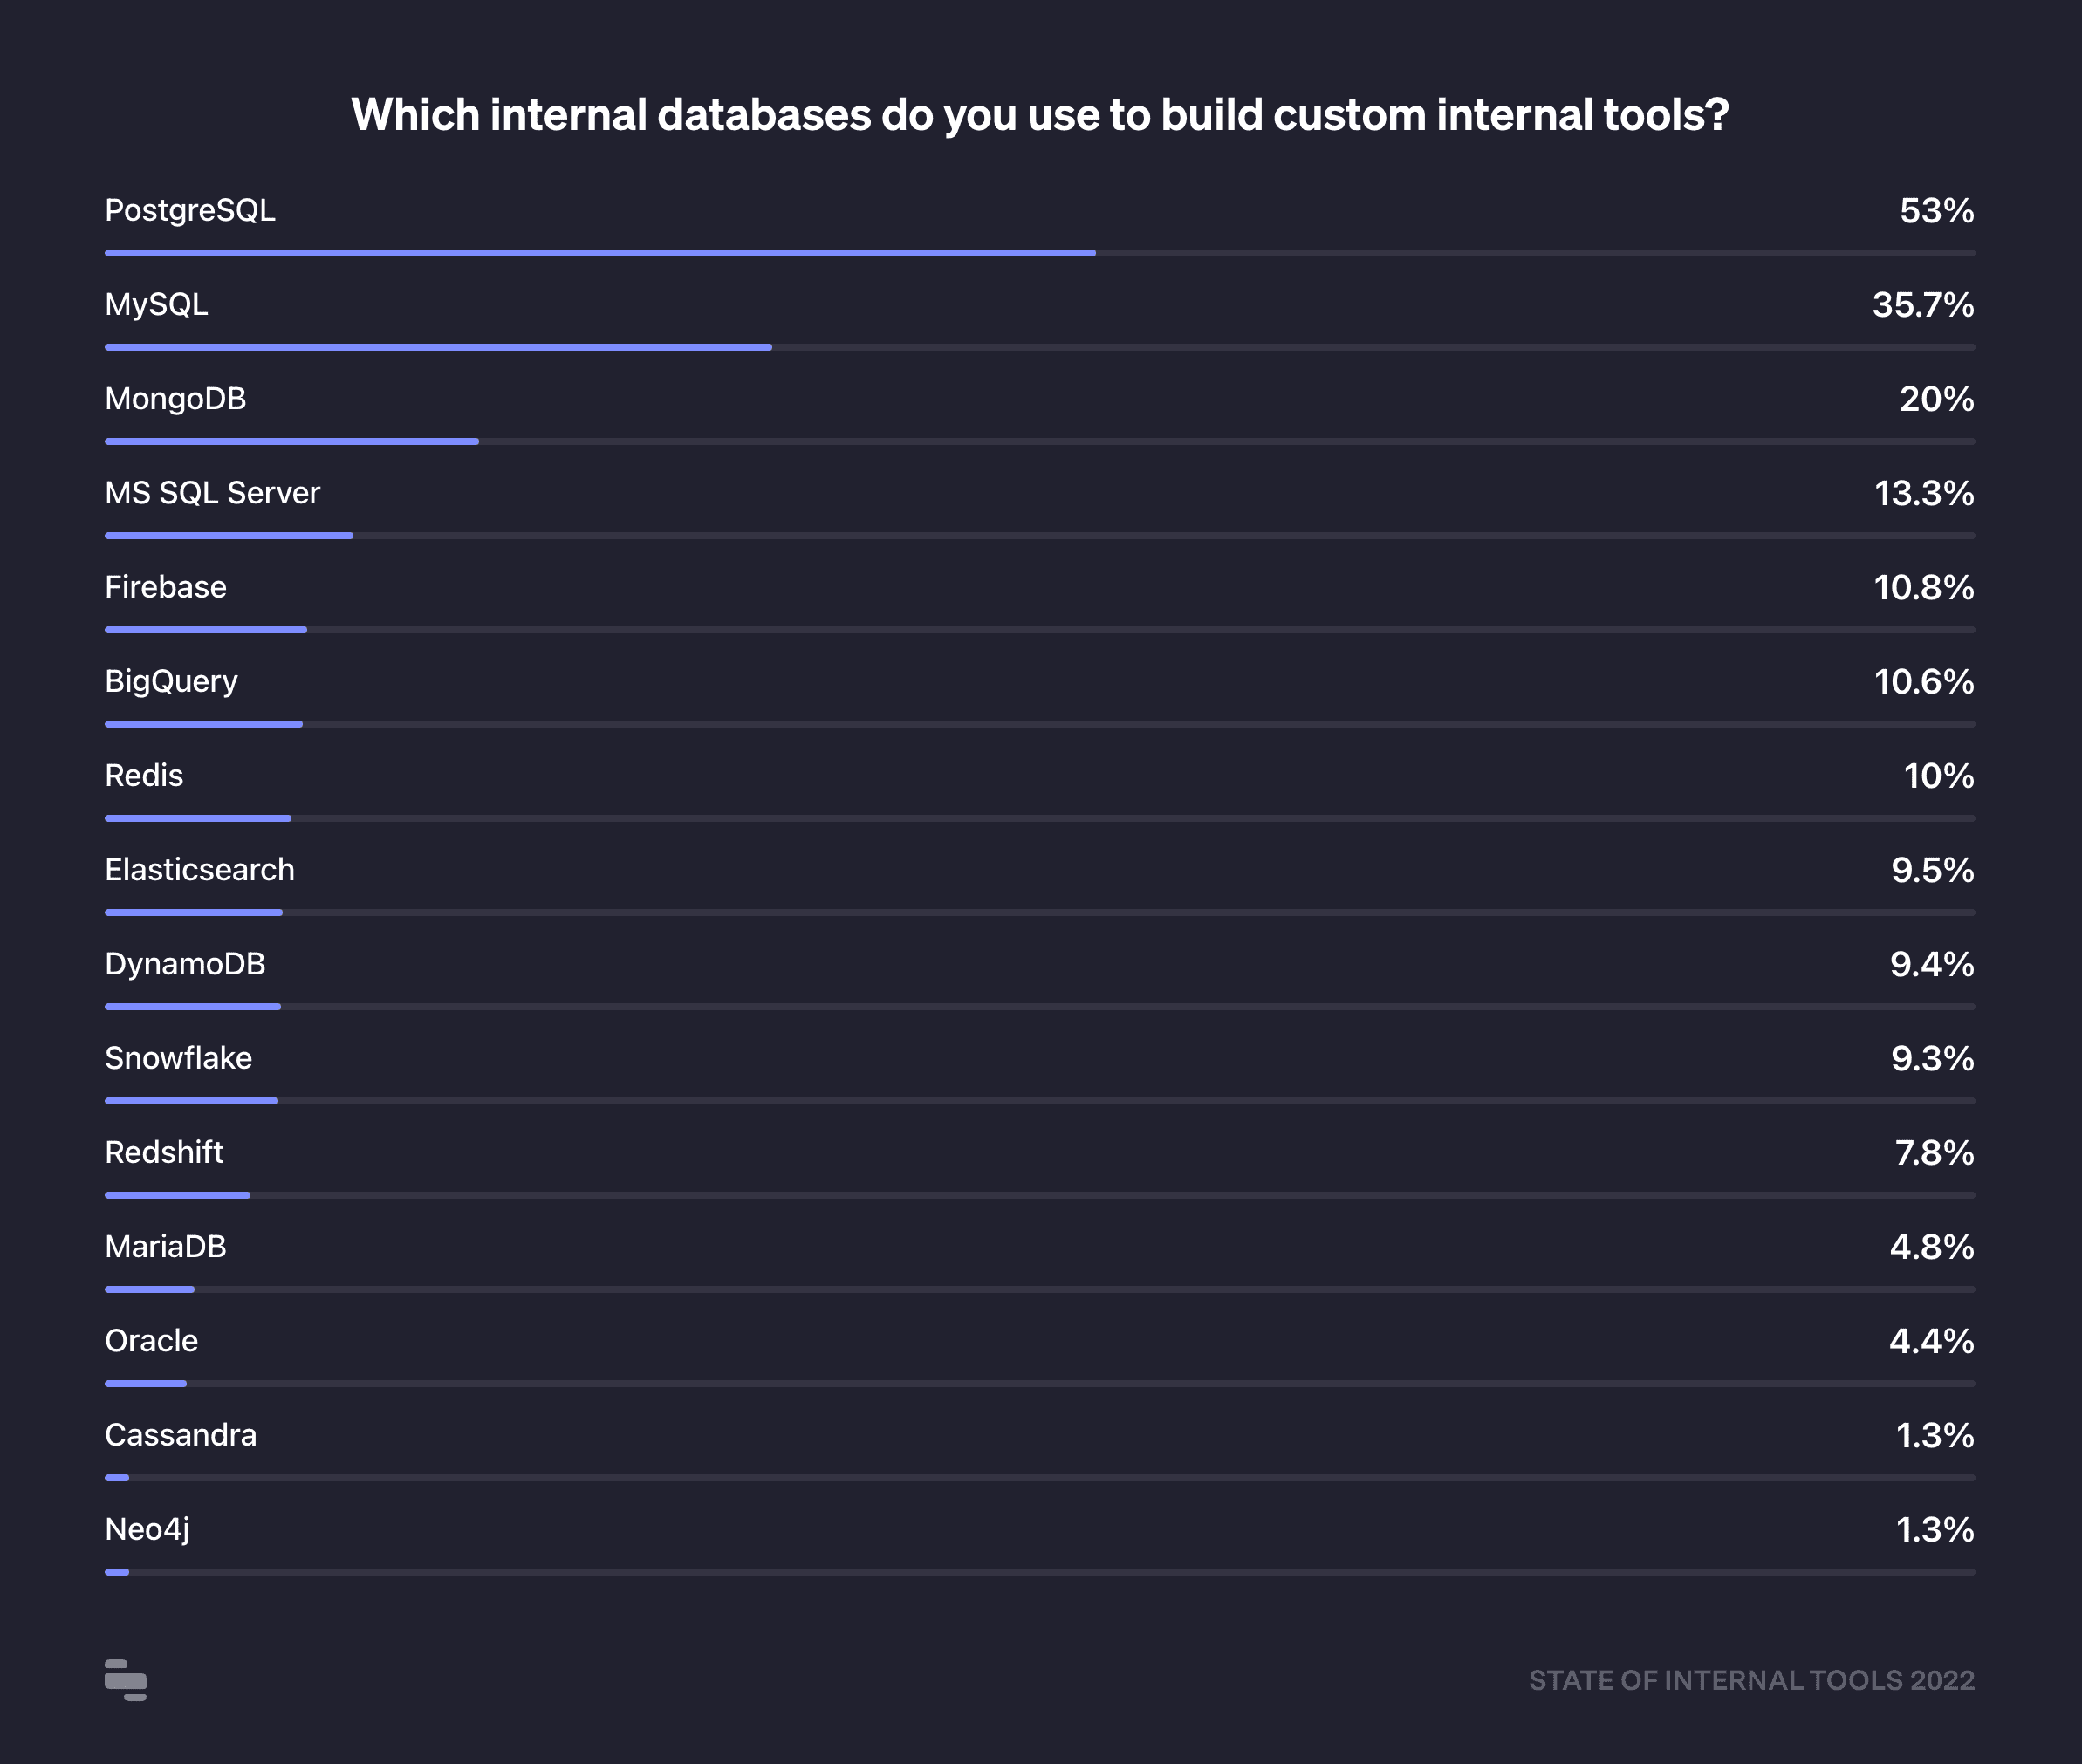
PostgreSQL is far and away the most popular database for internal tools (and perhaps by extension, as a production database among respondents). More than half of respondents who are building on an internal database are using Postgres, followed by 35% using MySQL, and 20% using MongoDB. The top five databases here are all production datastores (Postgres, MySQL, MongoDB, MSSQL, Firebase), but warehouses are also popular (e.g, BigQuery with 10%).
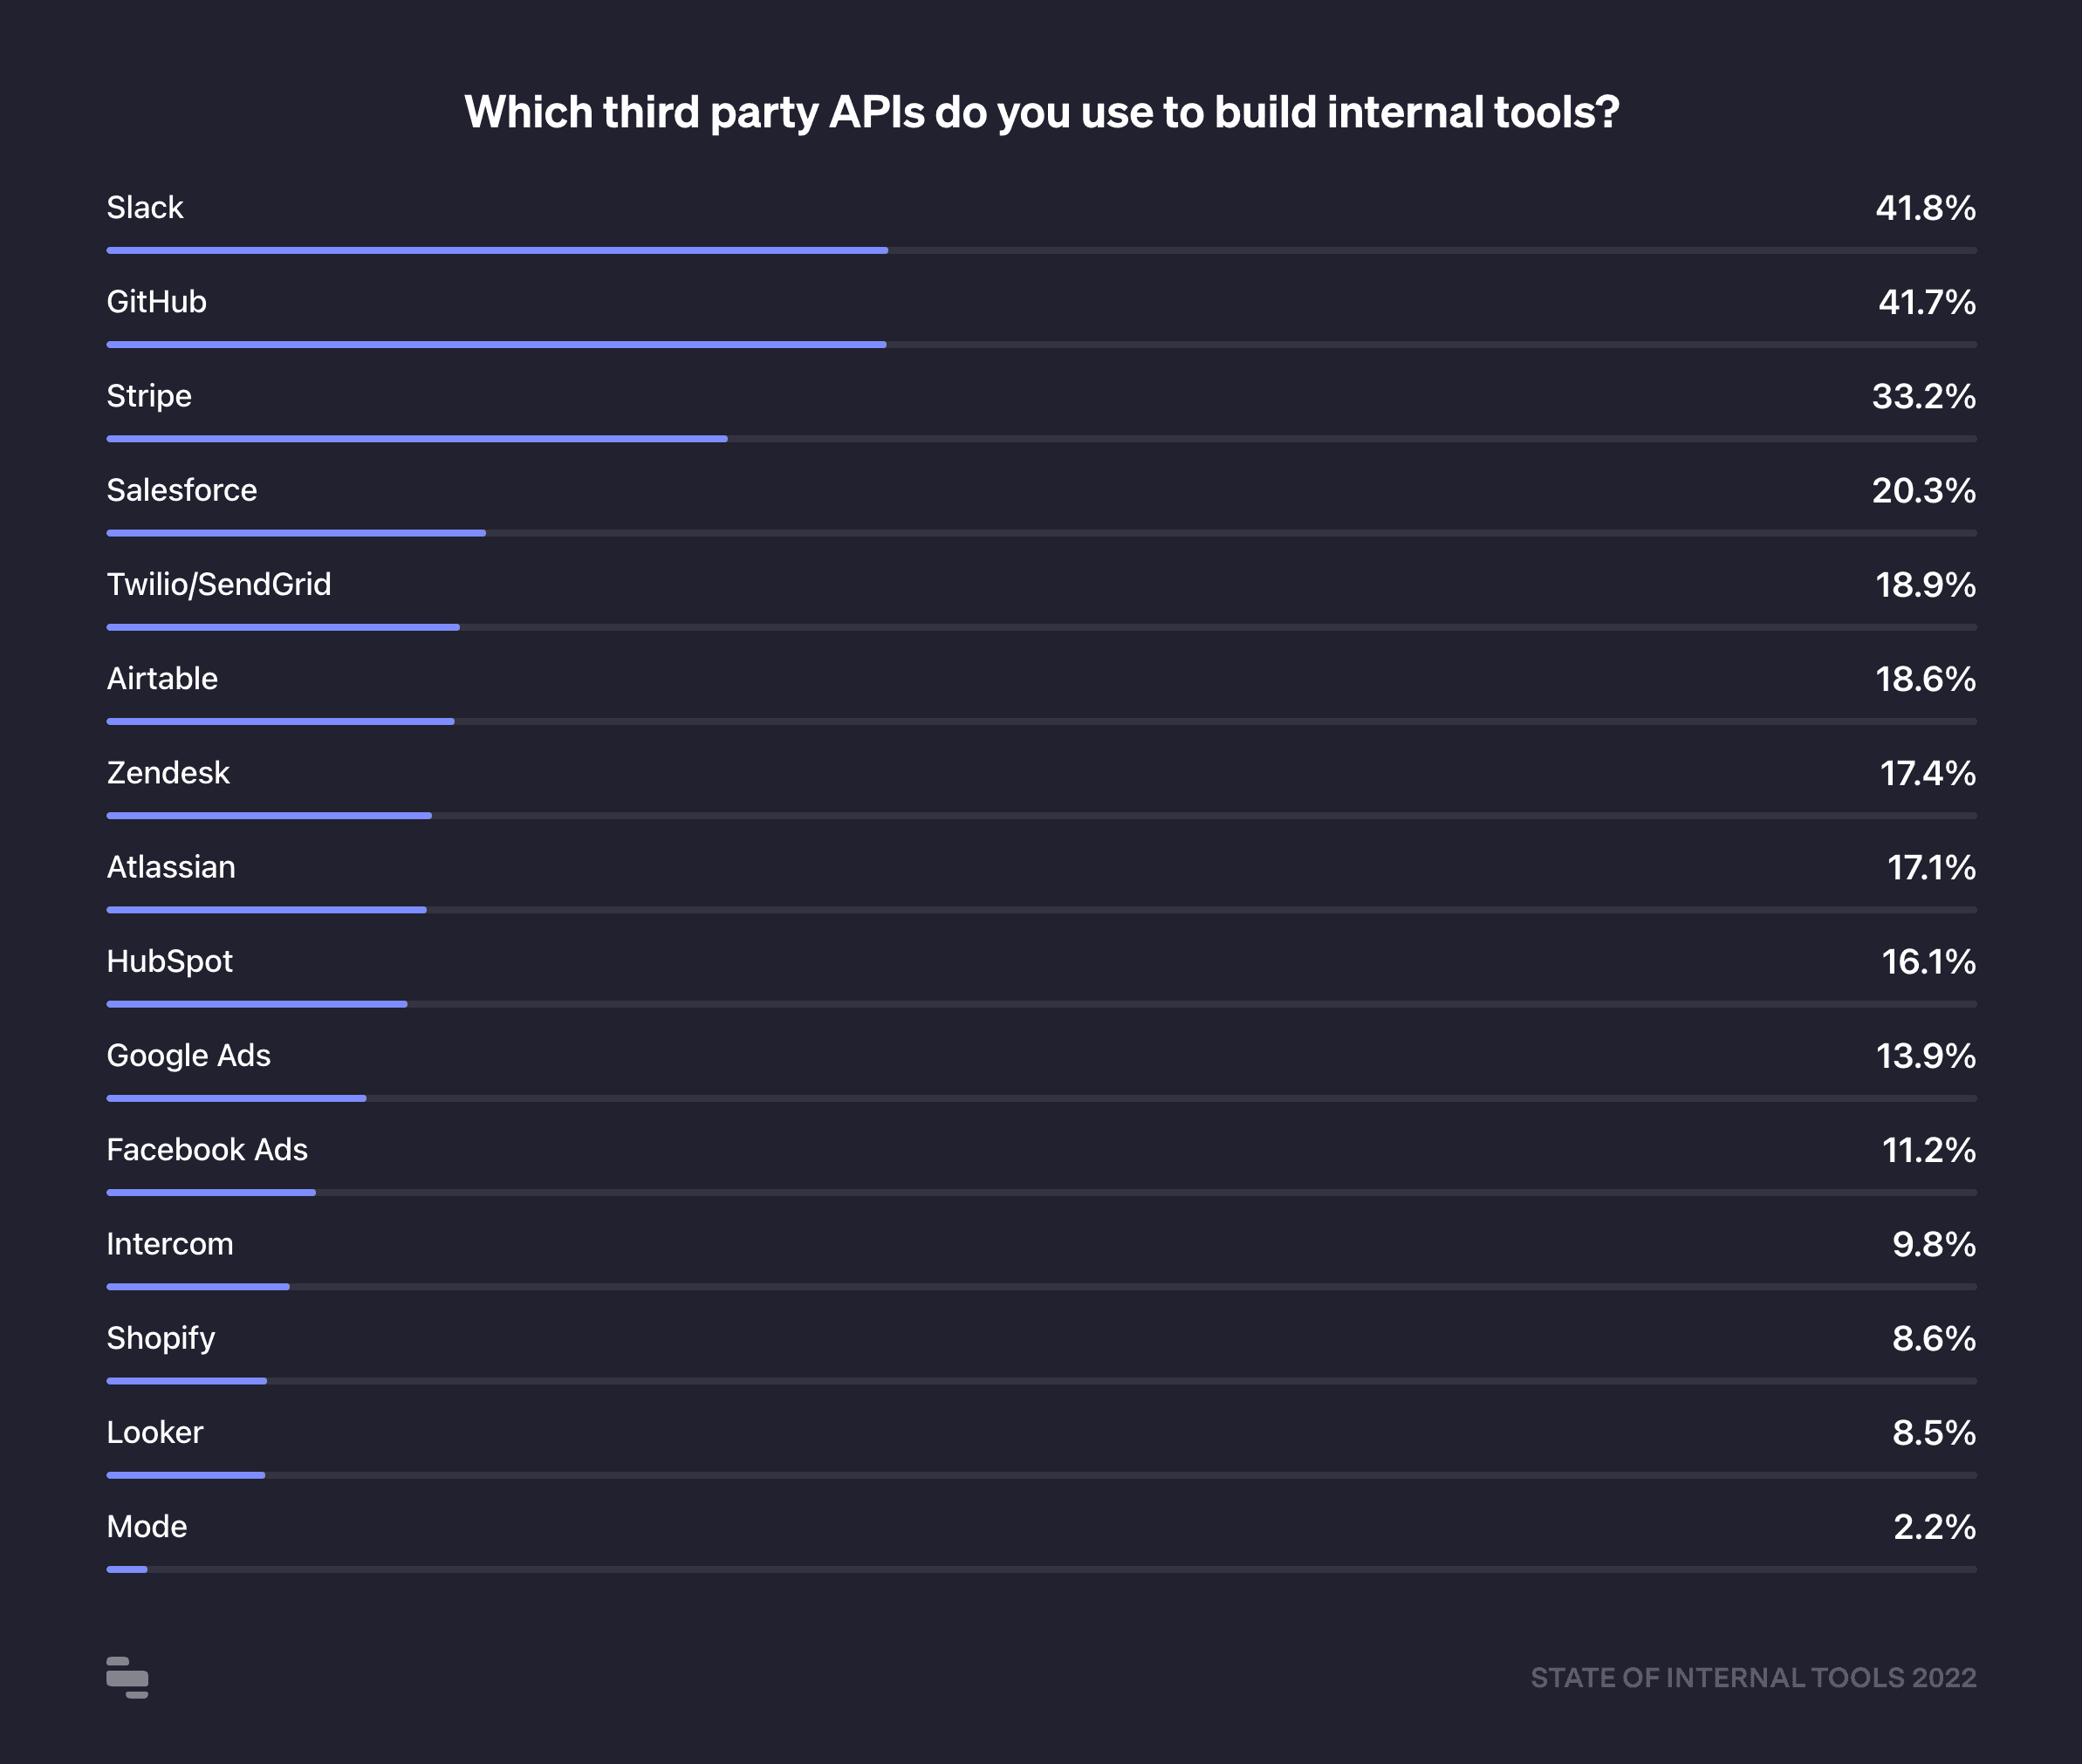
Among third party APIs, Slack, and GitHub are the most popular with 42% of respondents using them, followed by Stripe (33%) and Salesforce (20%).
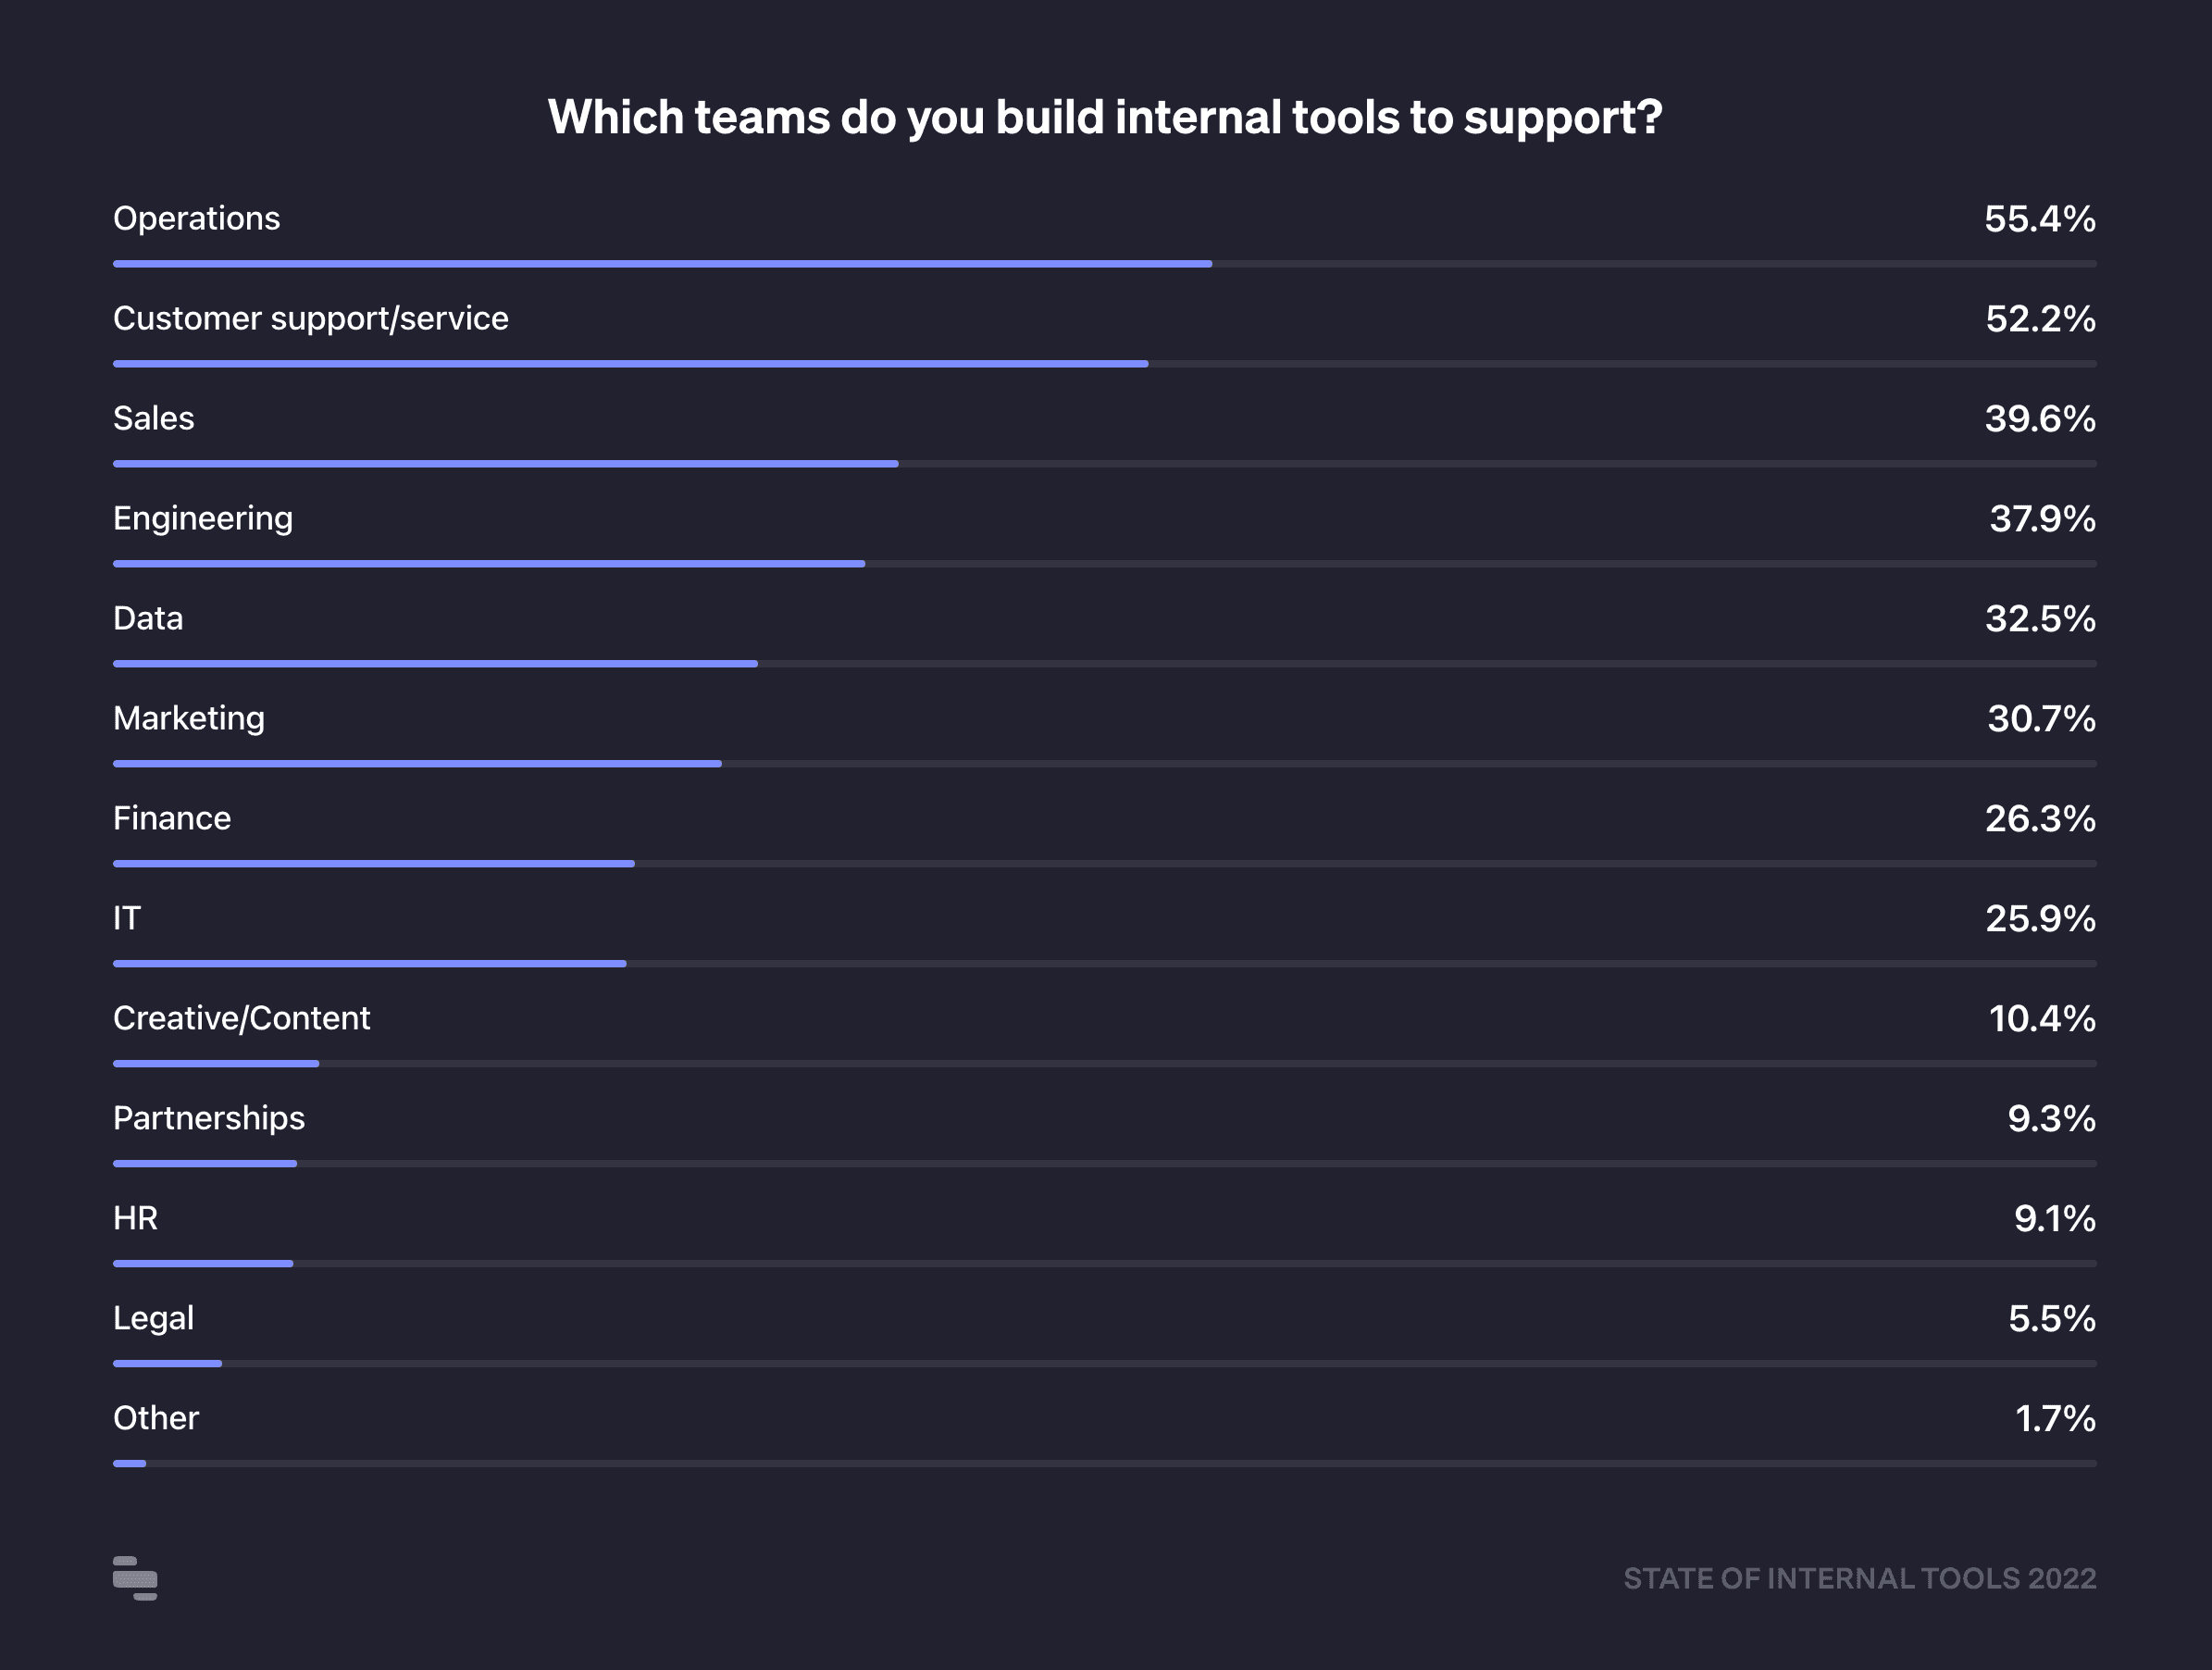
We asked developers which teams they're building internal tools for, and for the first year since we've run this survey (2020), operations teams were the most popular (55%) response, a huge increase from , where Customer Support (41%) and Engineering (41%) narrowly beat out Operations (40%). In 2022, Operations internal tools were the most popular for all companies with more than 20 employees.
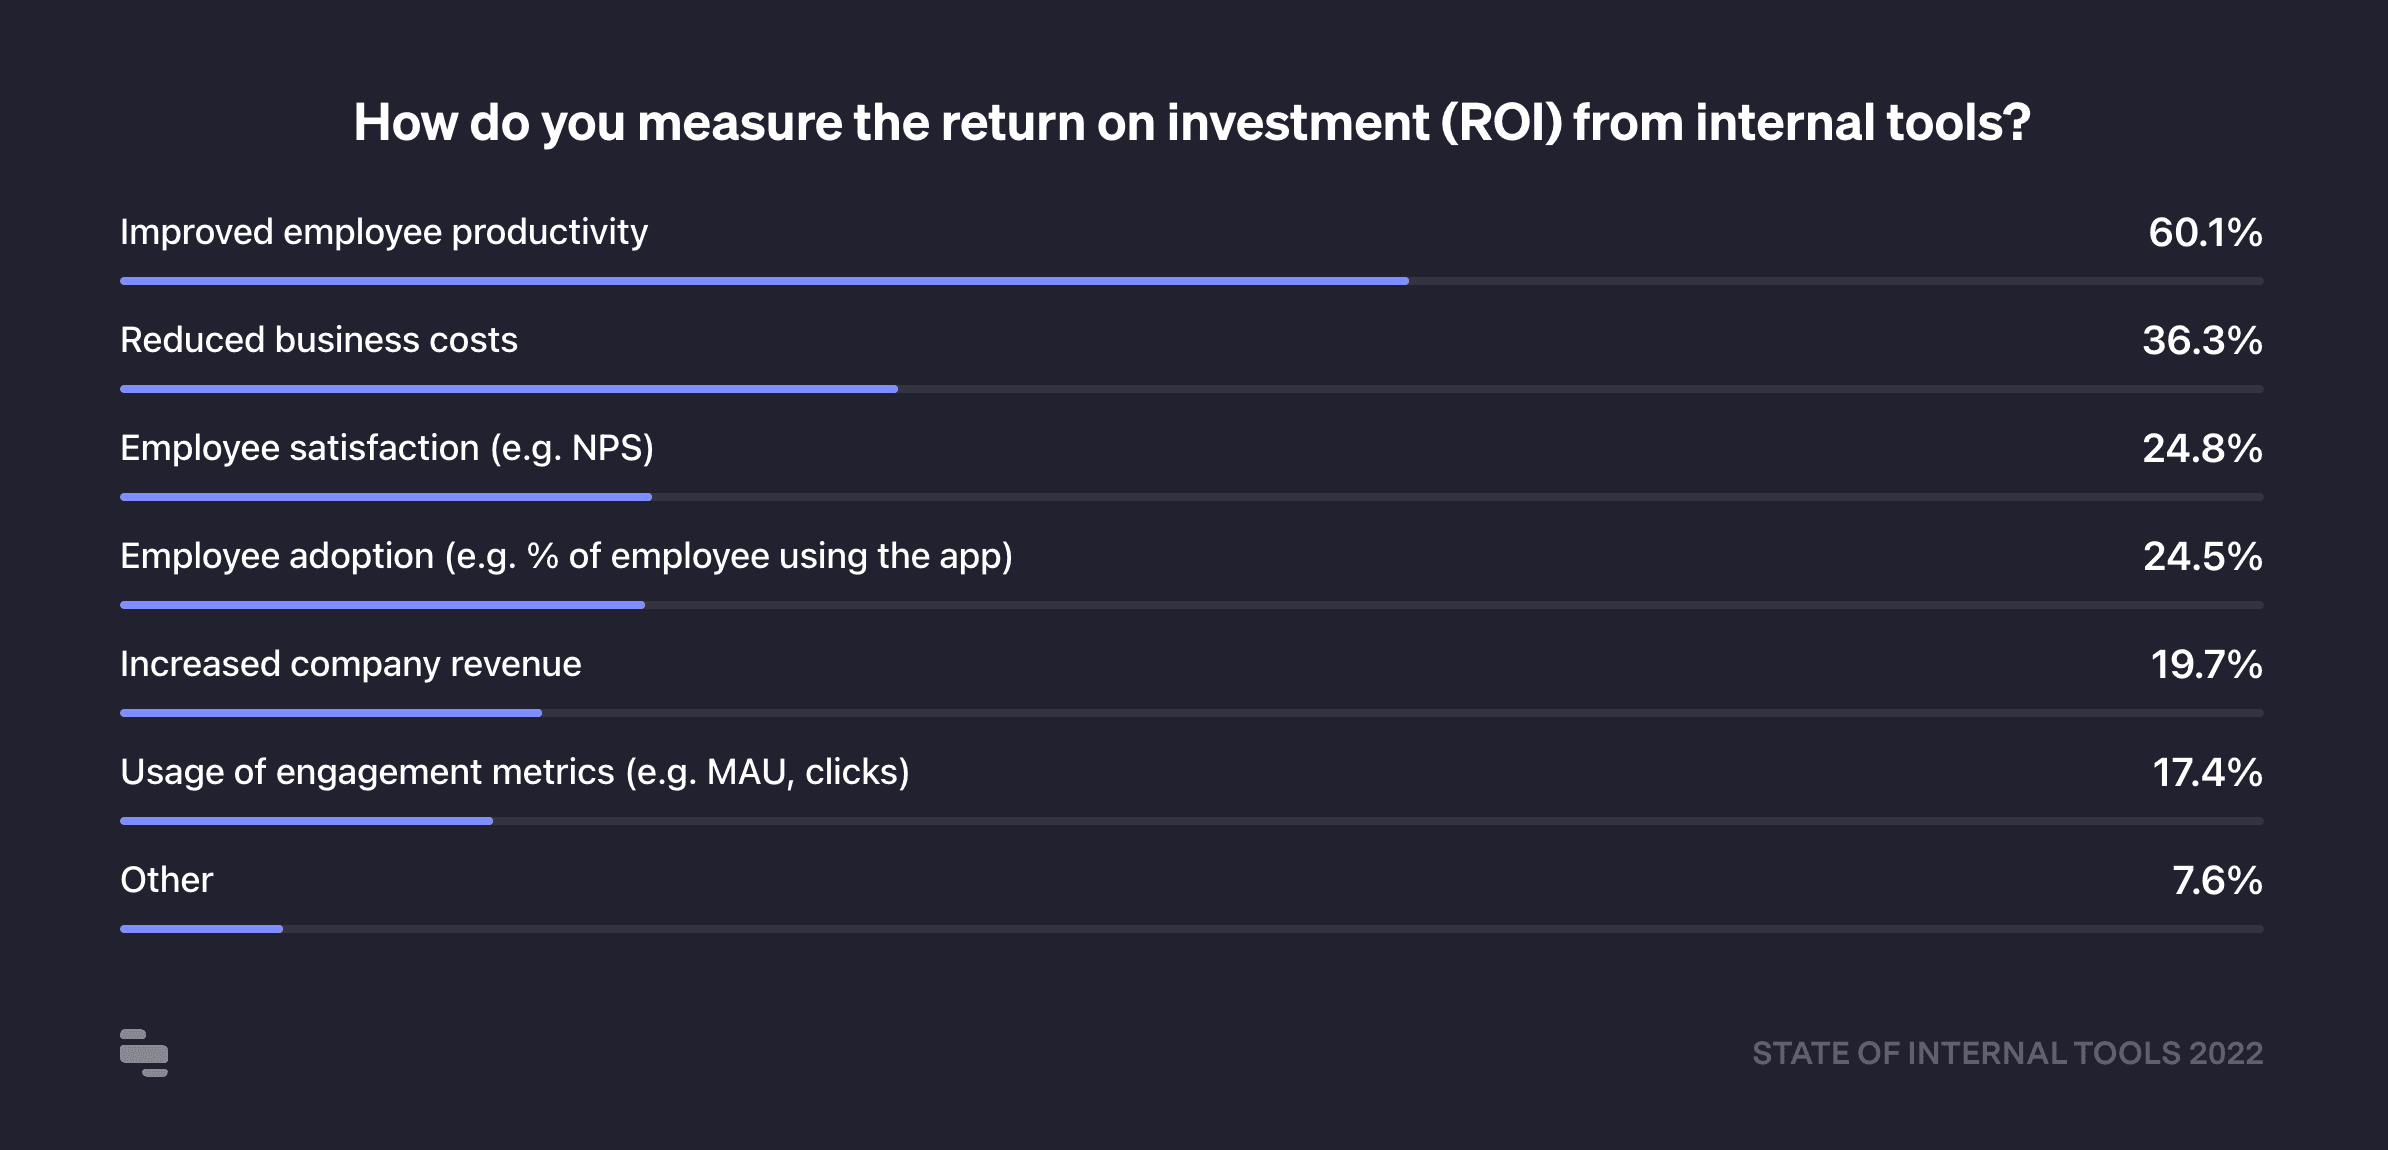
One hypothesis to explain this result is that there is a broadening definition of the Operations category (with specialized functions like BizOps, RevOps, or DevSecOps). The emergence of these teams also places an increased prioritization for tooling to increase operational efficiency. As we explore below, employee productivity is the top metric by which respondents measure ROI on internal tools. Outside of Operations, the teams for which engineers are building the most are Customer Support (52%), Sales (39%), and Engineering (38%).
Over a quarter of respondents say they don't have access controls for internal tools, presenting a sizable risk exposure. An individual with unfettered access to internal tools potentially has the ability to add, edit, or delete information easily, which could disrupt operations or corrupt sensitive information. While breaches are more common for external apps than internal tools, companies often hold critical employee and user information inside of their internal tools (not to mention extremely sensitive business information!). The high profile internal admin panel breach at Twitter in 2020 was a good reminder that companies should consider internal security measures with the same degree of deliberation they pay to their external practices. Read more about how Retool keeps customer data secure.

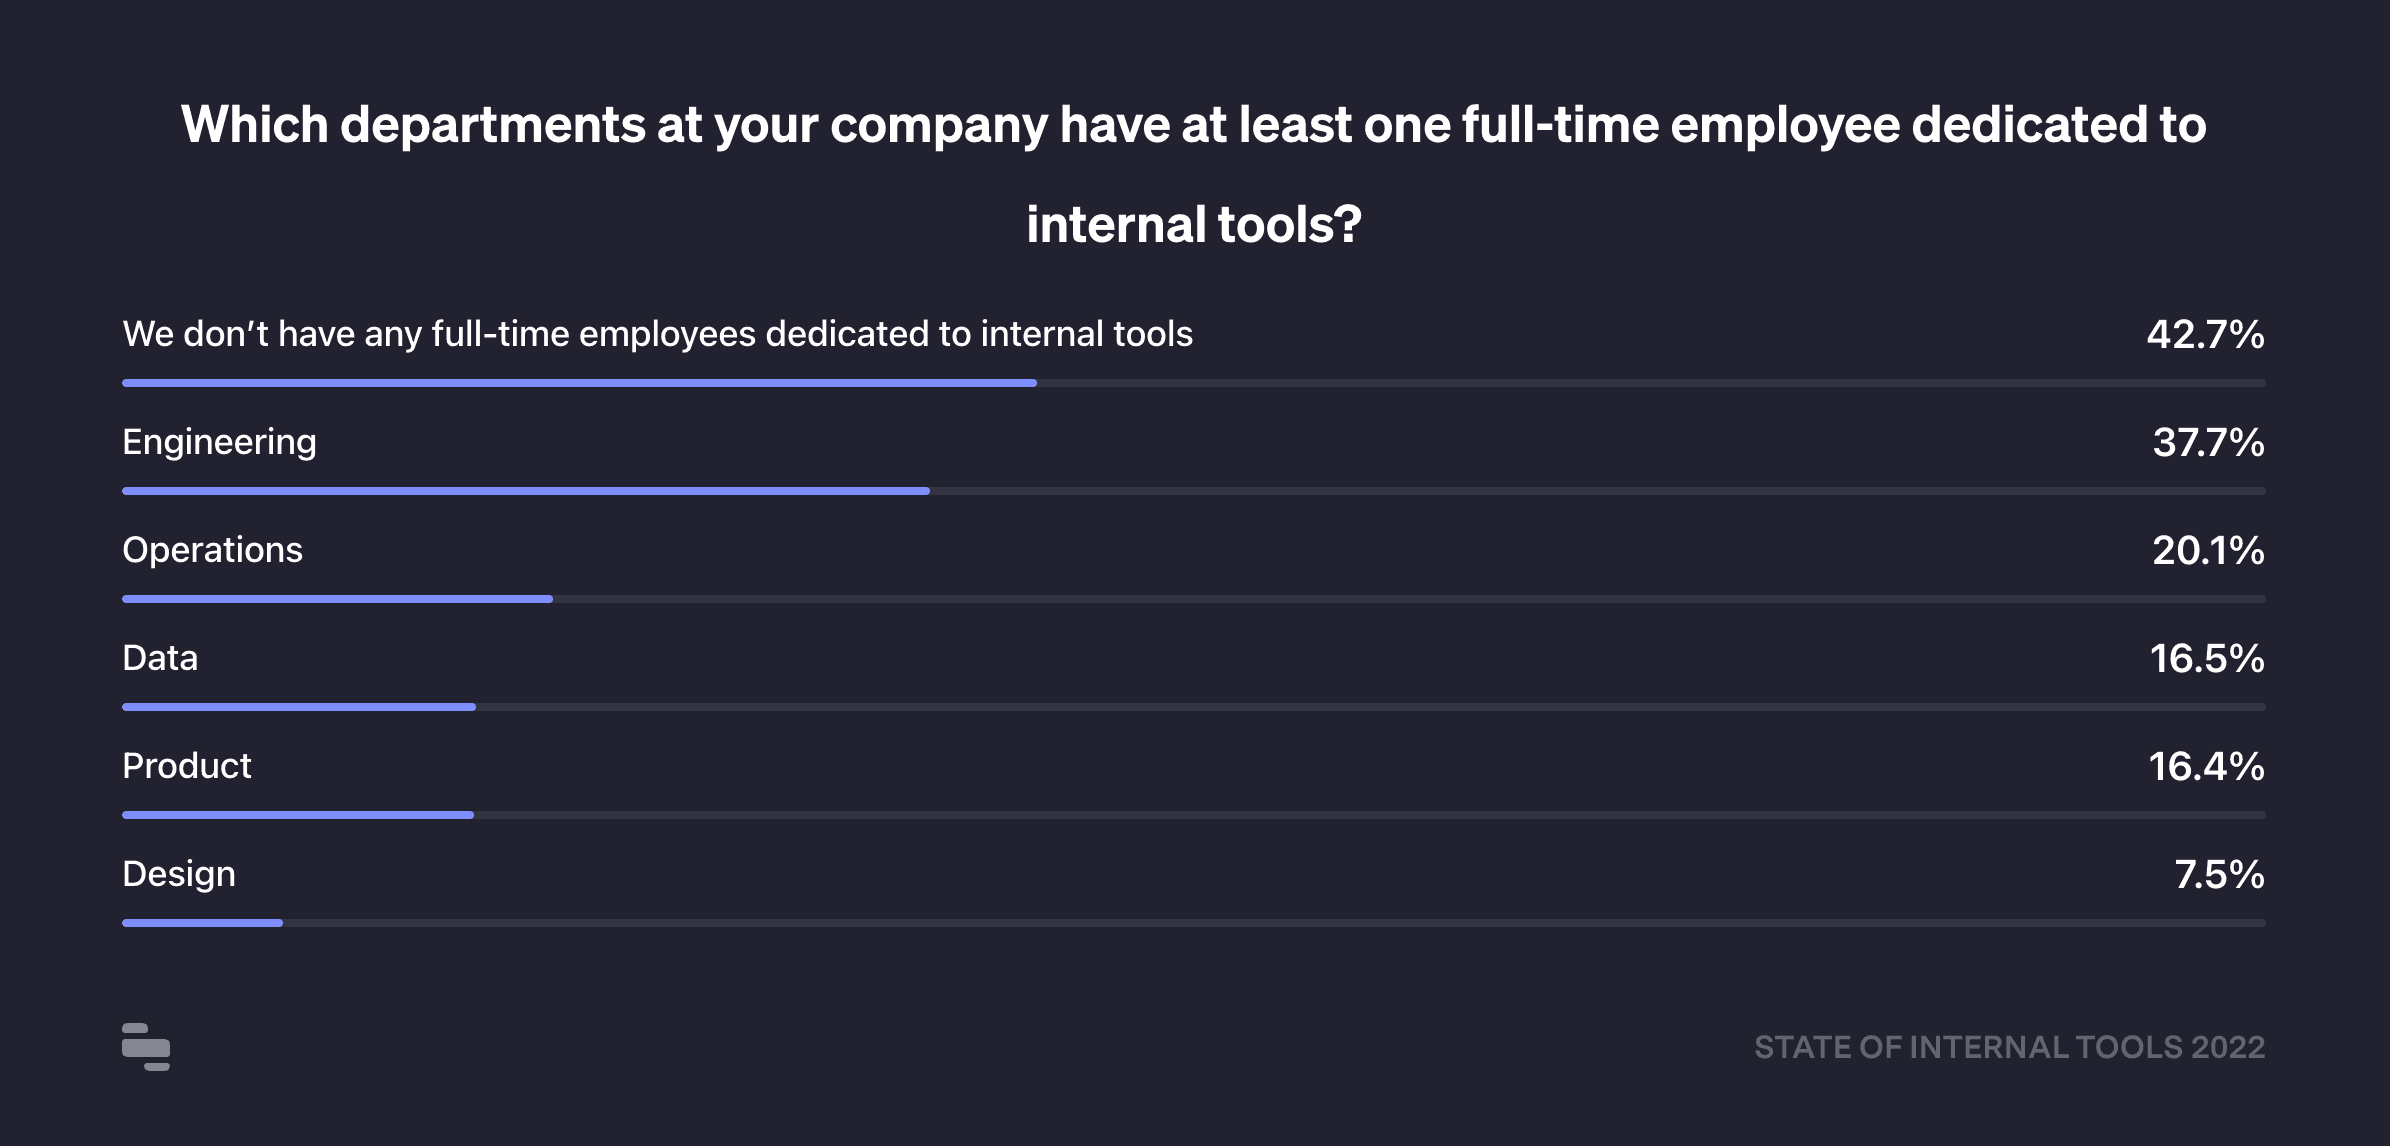
More than half of respondents (57%) indicated that their company has at least one full-time position dedicated to building or maintaining internal tools.
Unsurprisingly, the majority of those positions are in Engineering (38%), followed by Operations (20%), then Data (17%).
Survey respondents indicated that improved employee productivity (60%, up from 54% in 2021) is their North Star metric for tracking ROI from internal tools. Productivity, which is admittedly nebulous to measure in and of itself, was followed by the more quantitative responses of reduced business costs (36%), and employee satisfaction (25%).
This year's report highlights trends that have persisted for several years — like how most companies measure internal tools on productivity gains and the technologies we use to build them (e.g. React, Postgres, automation platforms). It also highlights trends that speak to big opportunities for internal tools, like how much time is spent on building and maintenance, and how much room there is for more security investments.
The insights in this report were gathered from a public survey of 2285 developers and technical leaders in May 2022 — with active Retool customers representing 87% of respondents. Please see below for a deeper breakdown of respondents by industry, country, and role.
Top 5 industries
- Information Technology, 21% of respondents
- Financial Services, 15% of respondents
- Retail, 9% of respondents
- Data & Analytics, 8% of respondents
- Healthcare, 7% of respondents
Top 5 countries
- USA, 45% of respondents
- India, 10% of respondents
- UK, 6% of respondents
- Canada, 4% of respondents
- Germany, 4% of respondents
Top 5 roles
- Full-stack Developer, 20% of respondents
- Product Manager, 11% of respondents
- Backend Developer, 10% of respondents
- Co-Founder, 9% of respondents
- Business Operations, 8% of respondents
Reader


