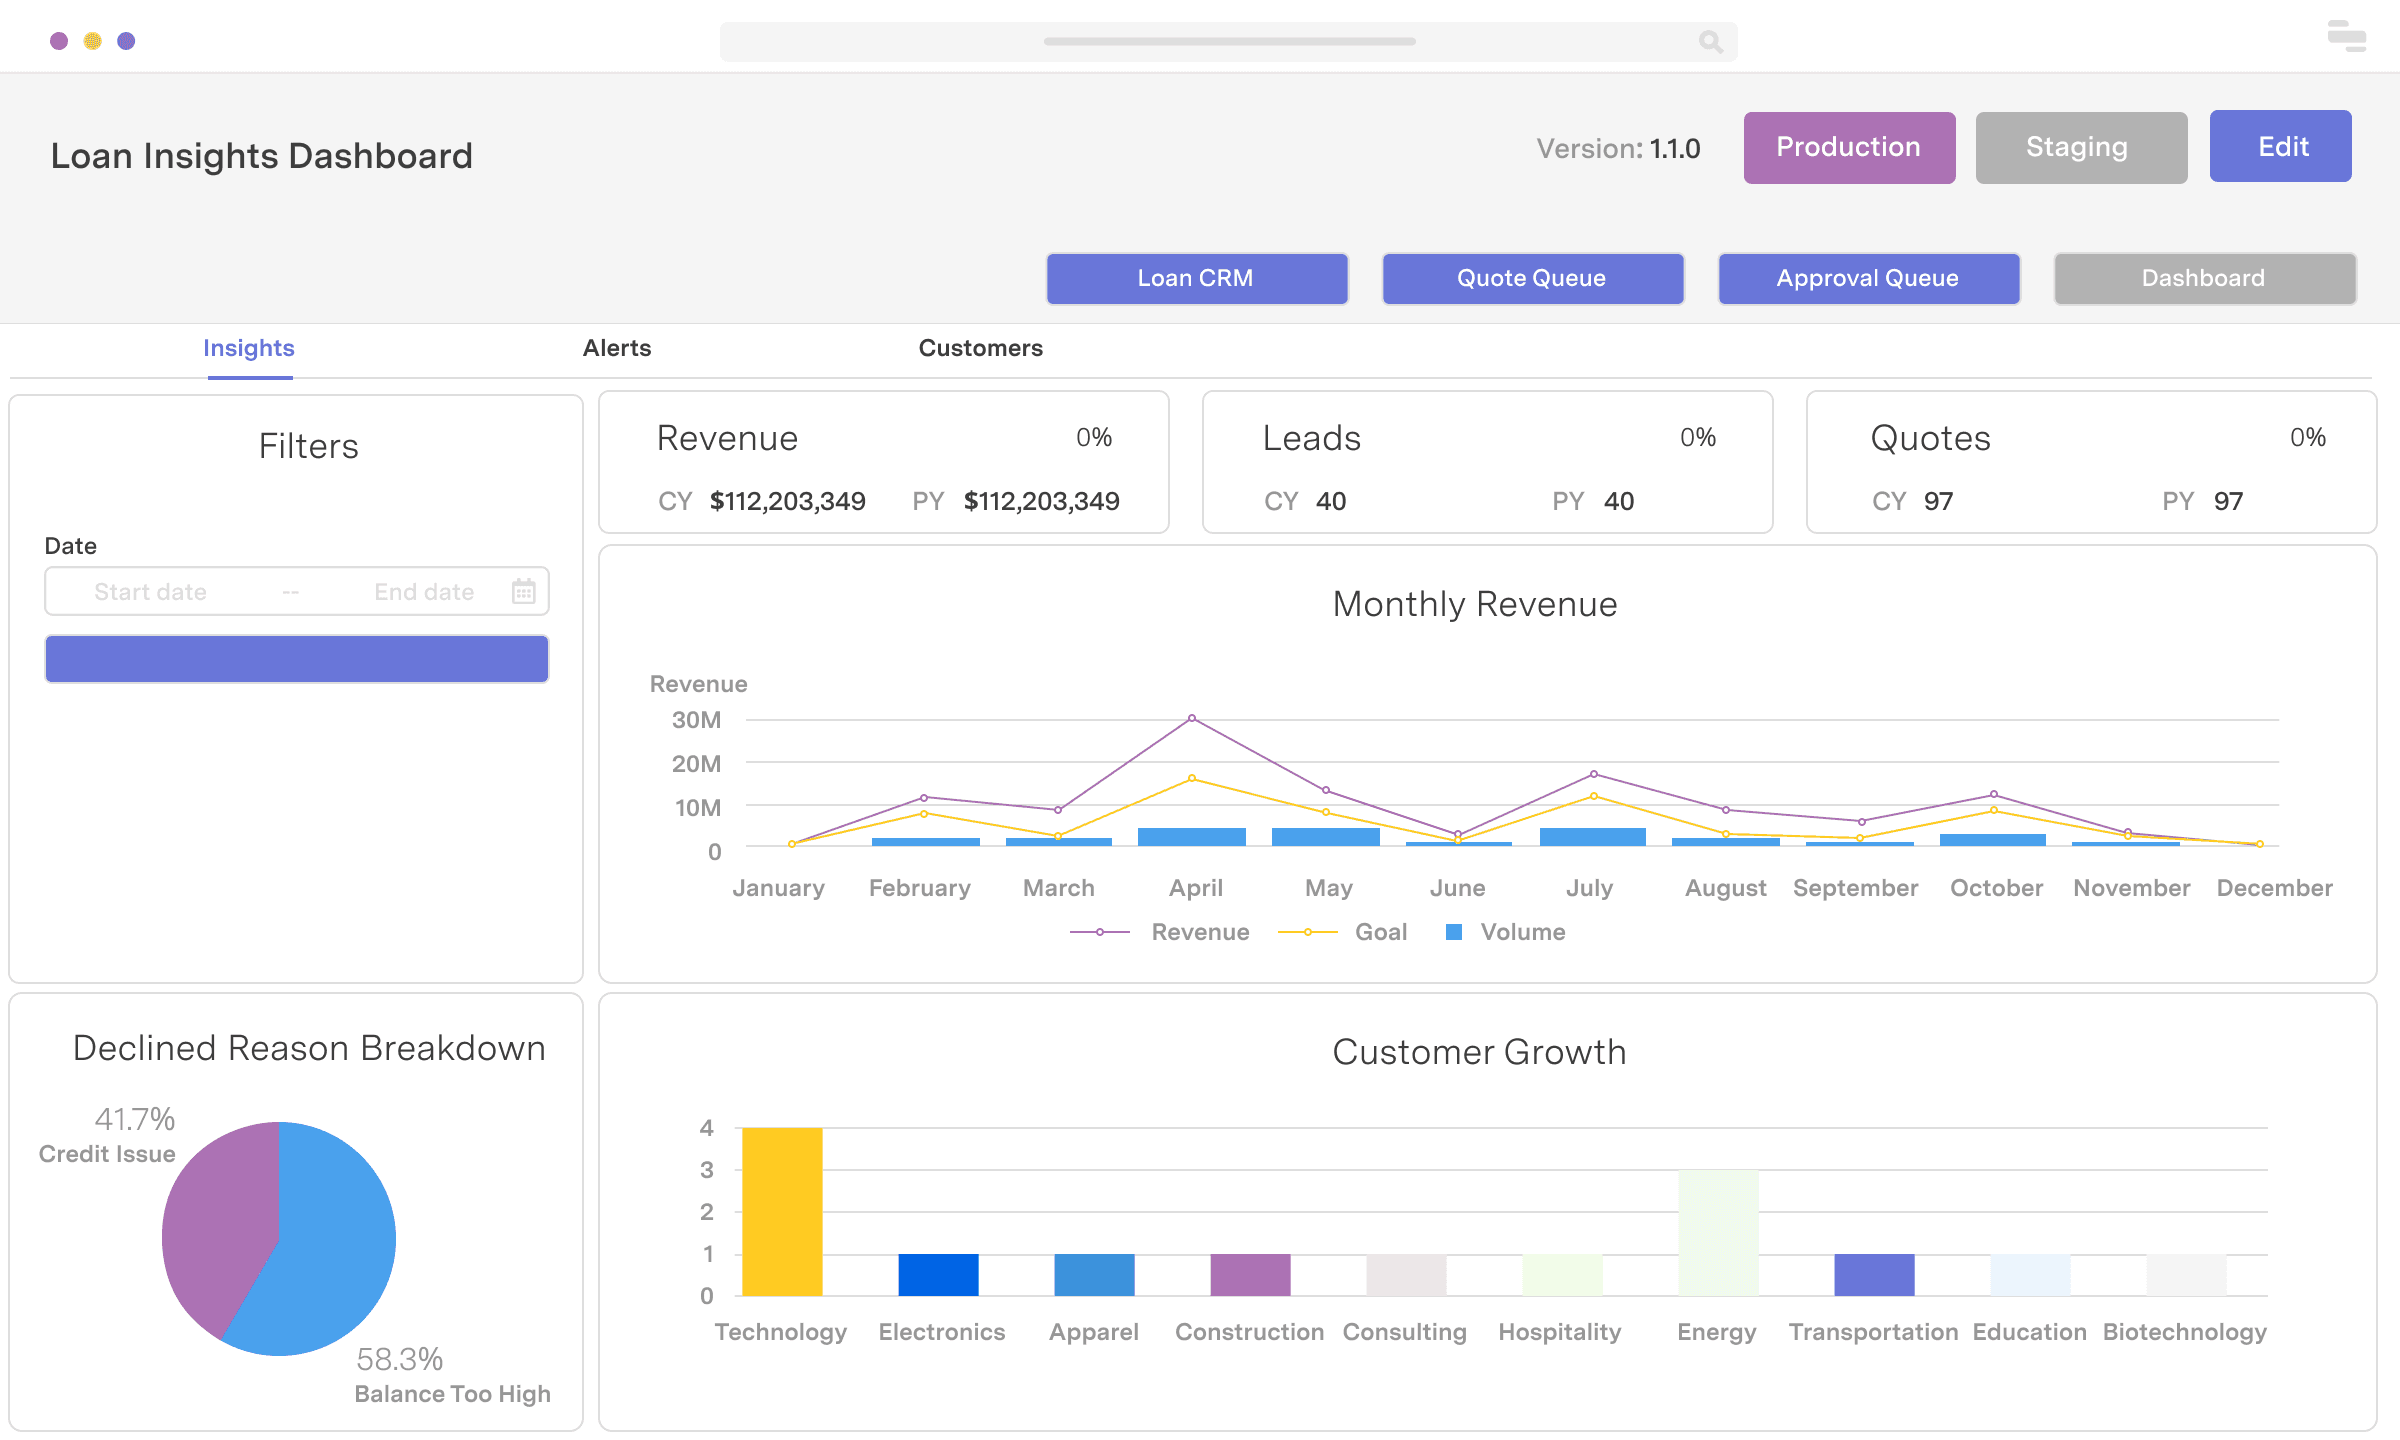
A fast and simple way to visualize MongoDB data using Charts
Explore, visualize, query your MongoDB data with Retool's chart component. But don't stop there — add in any other data sources into the same dashboard, and make your charts interactive and actionable.
Industry
Software as a Service
End users
Engineering
Components
2+

Components
Build from a handful of drag-and-drop components
Table display the output of a query and control your table appearance and the visible columns.
Text the simplest components out there — use text components statically as labels, or dynamically to display values.
Button trigger actions that do things like run queries, export data, or open other apps.
Text Input take a text input to modify the parameters of a query — say the `ILIKE` in a SQL statement, or a URL parameter in a REST query based on the value of the component.
Dropdown allow users to select one value from a list of options.
Container organize your admin panel by using containers as top-level components and to nest other components.
Data source
Connecting your Mongo data to Retool is easy: just grab your credentials or use a connection string. Retool’s MongoDB client supports Atlas as well as self-hosted MongoDB on other clouds.
 1. Create resource
 2. Read data
 3. Connect data with UI
From startups to Fortune 500s, the world's most effective teams use Retool to build custom business software. Our customers↑


“We would have had to hire 2-3 full-time engineers to build what I did in 30 minutes using Retool.
We would have had to hire 2-3 full-time engineers to build what I did in 30 minutes using Retool.
JJ Maxwell
Co-Founder and CRO at JetFuel
Supercharge your business today.
Start building an internal tool or customer portal in under 10 minutes.