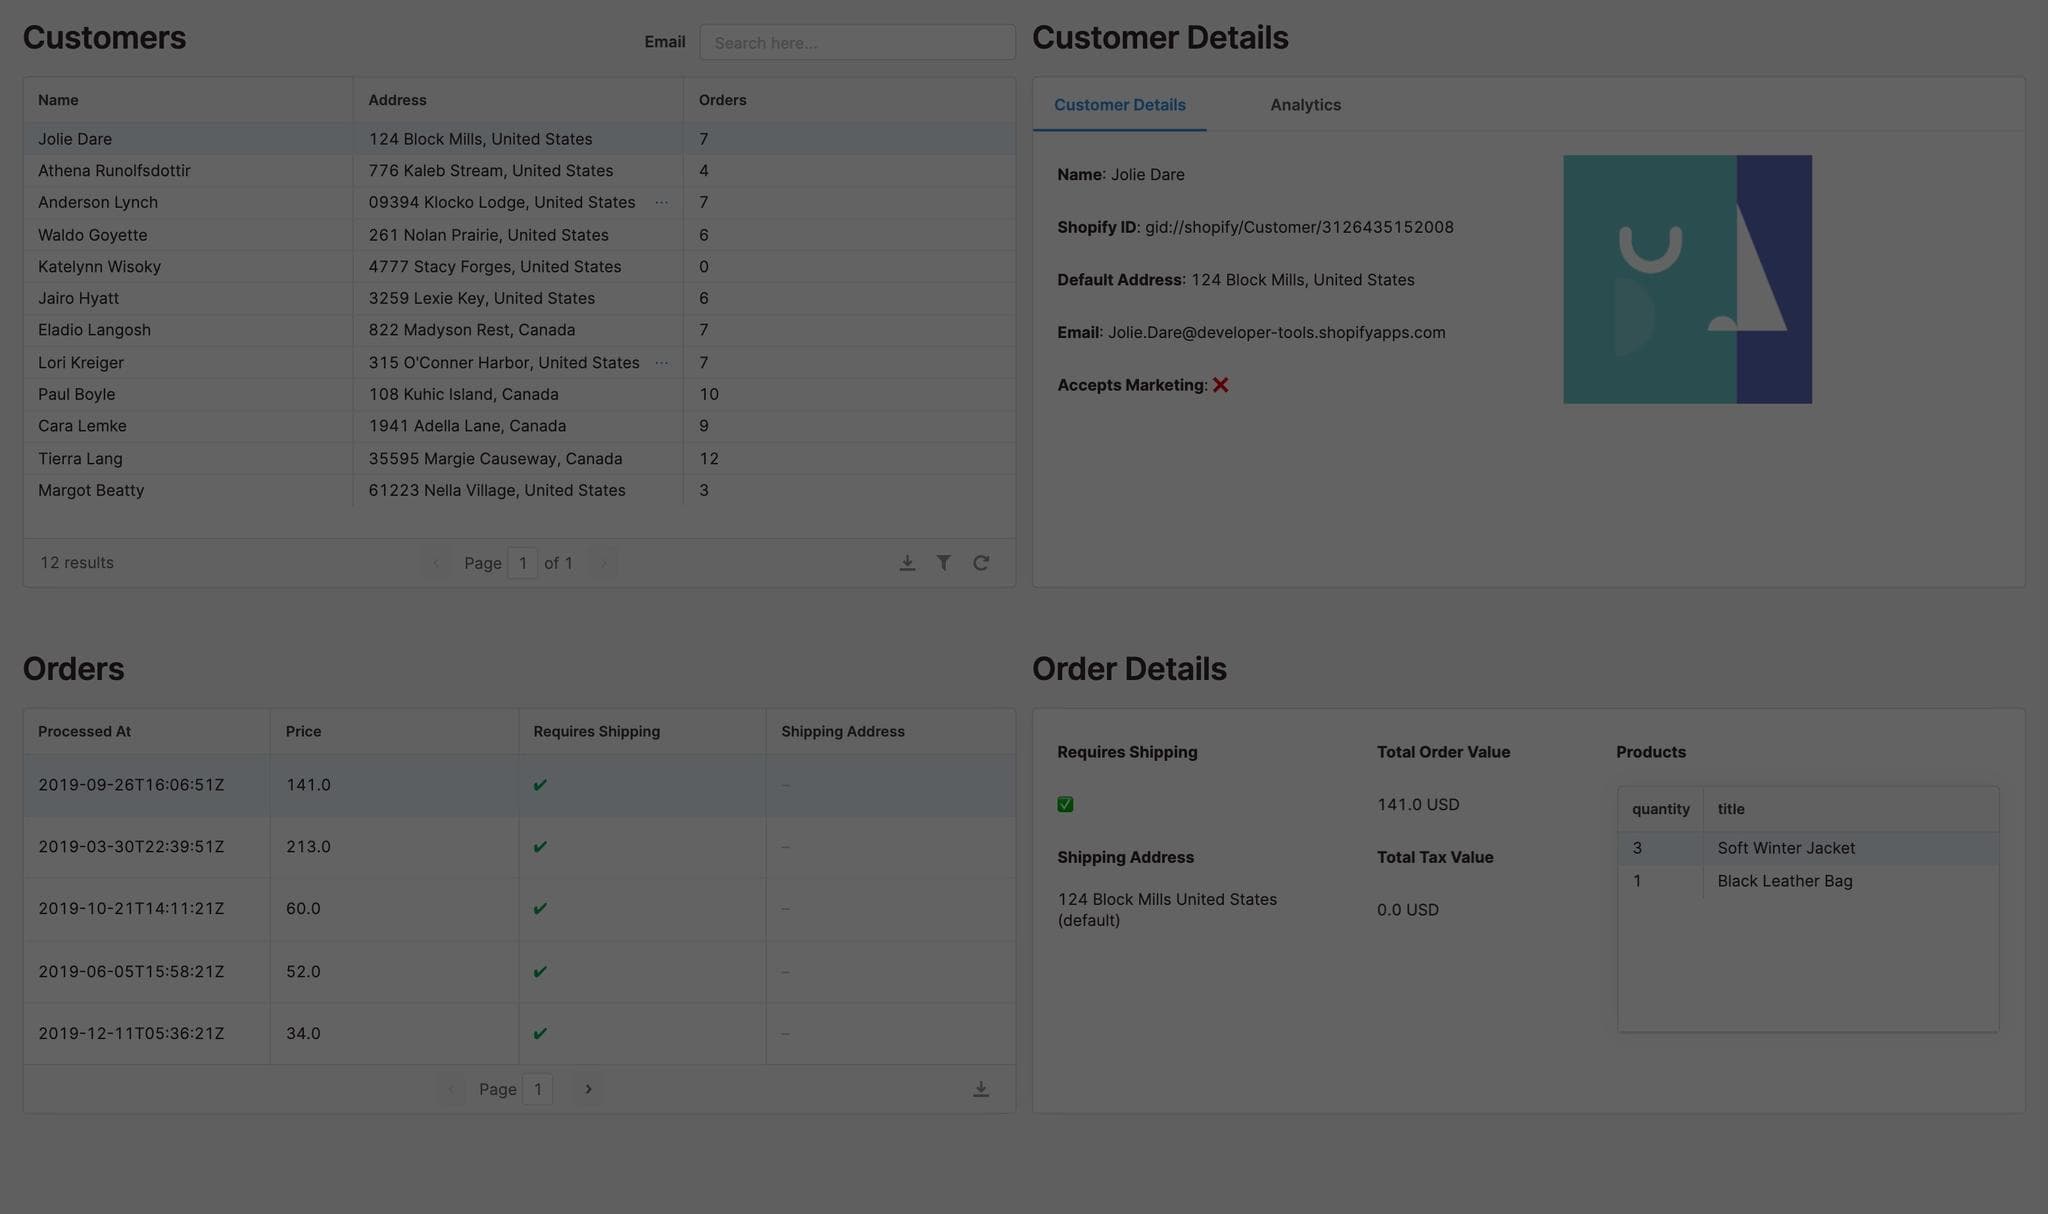

If you’re selling something that needs shipping, chances are you’ve heard of Shopify. And if you’re one of the over 1 million merchants selling on Shopify, visibility is key: you need to know who you’re selling to and what they’re buying. We’re going to build a customer dashboard that lets you see orders and products in one view using the Shopify GraphQL API in Retool.
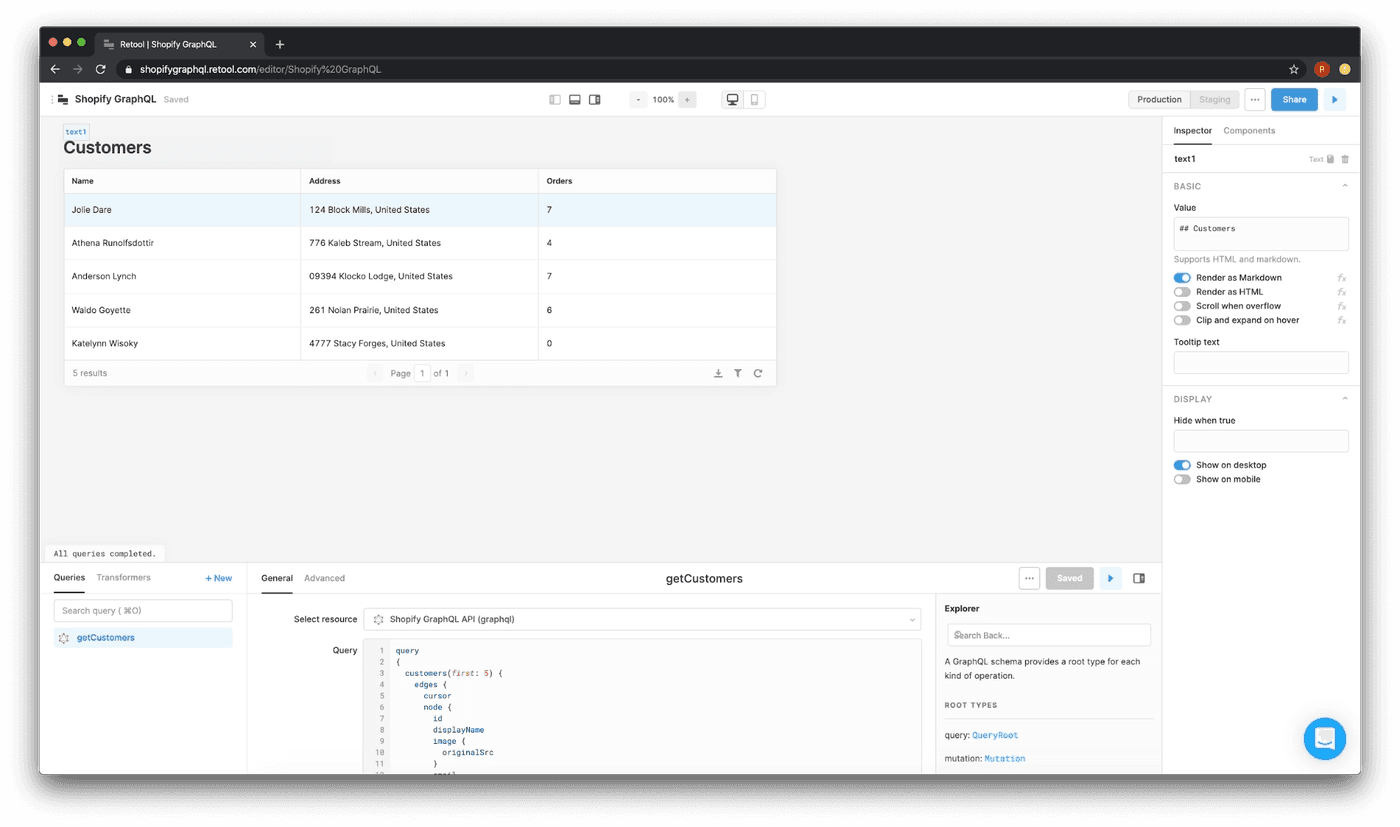
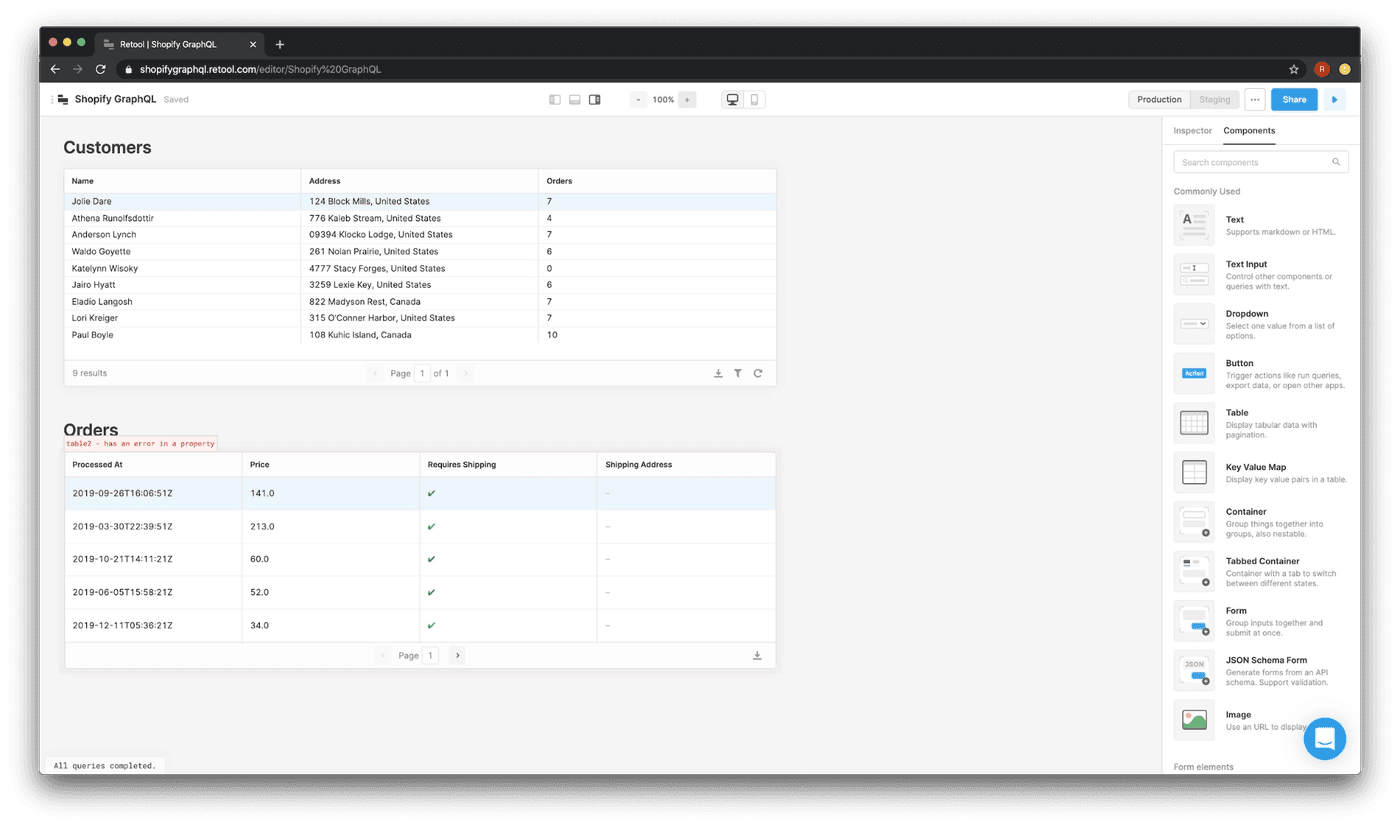
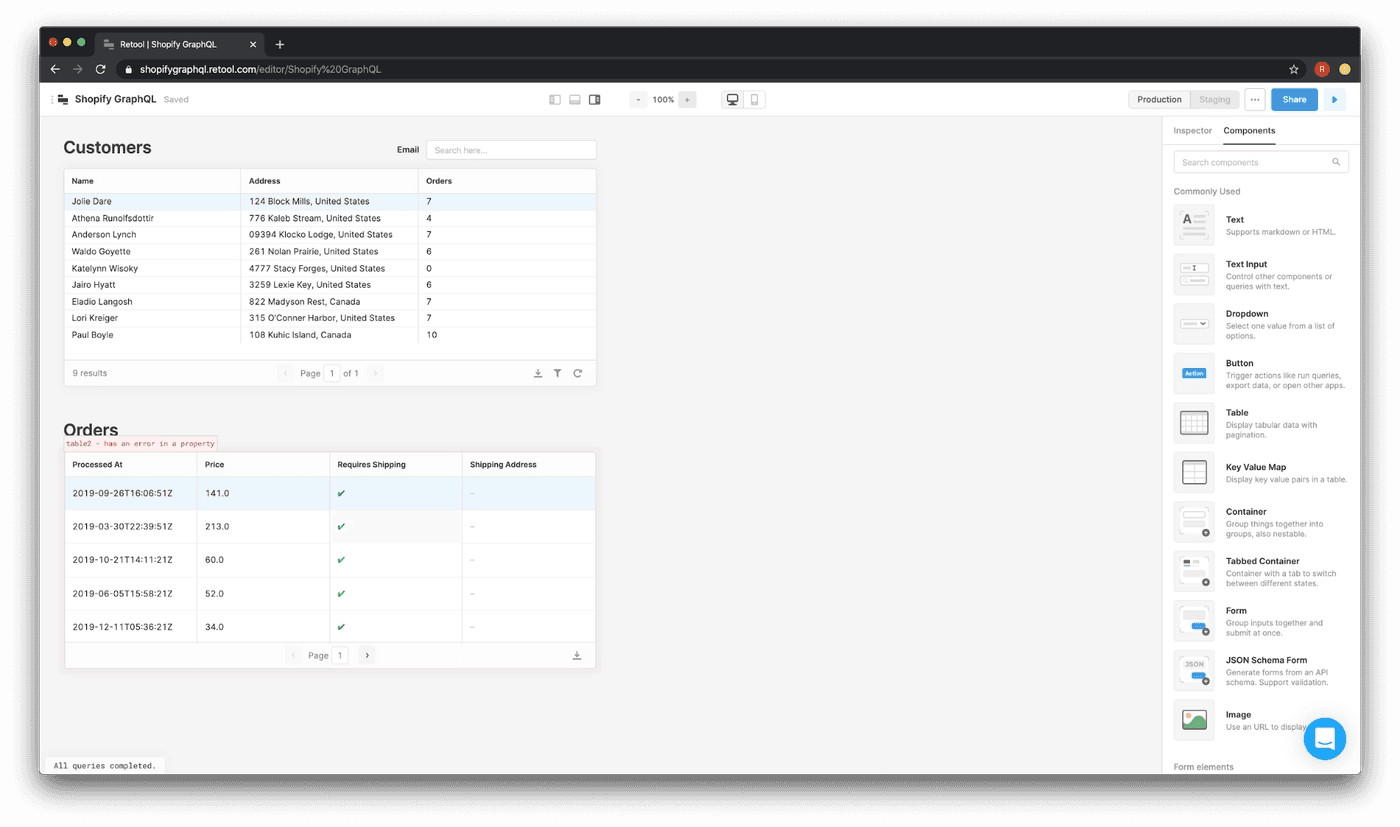
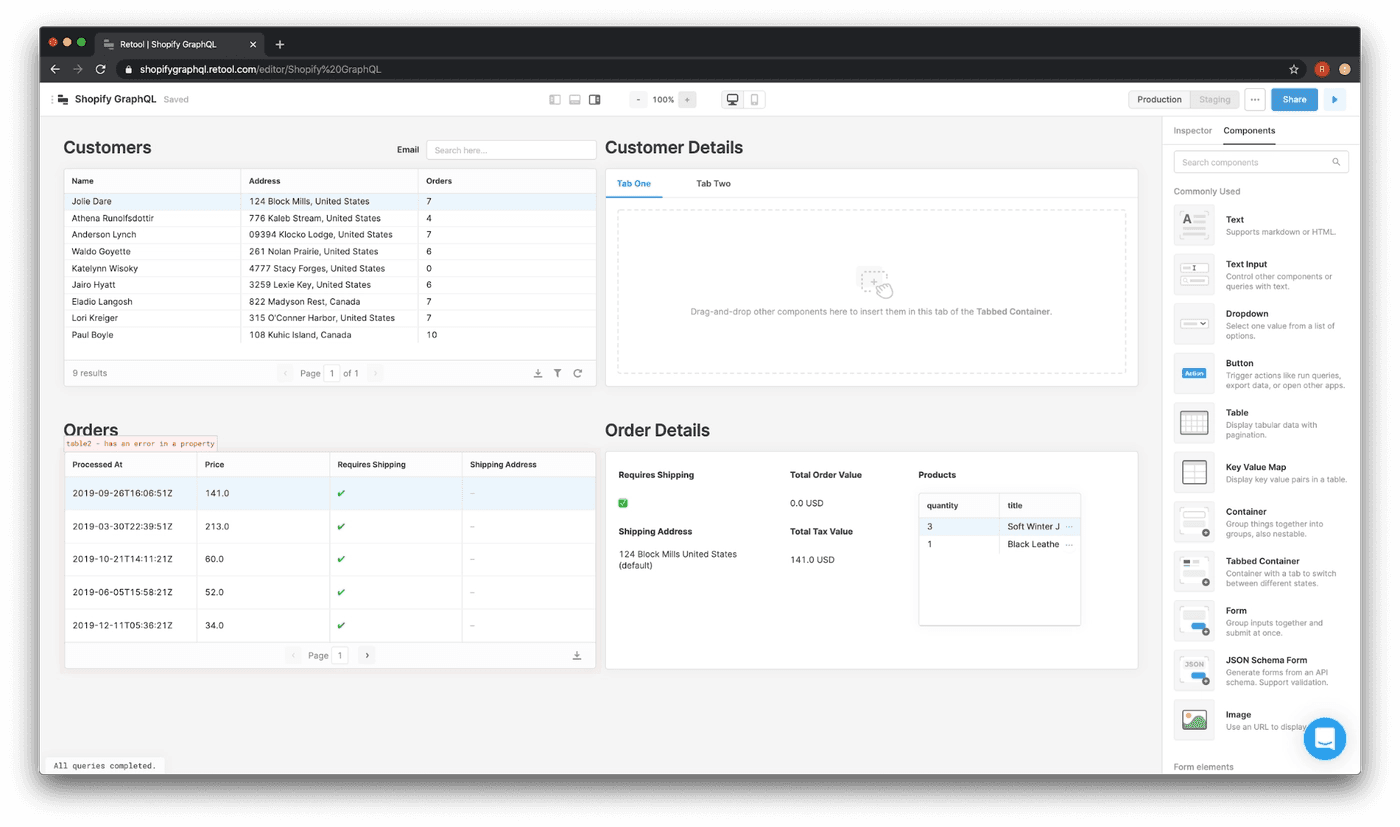
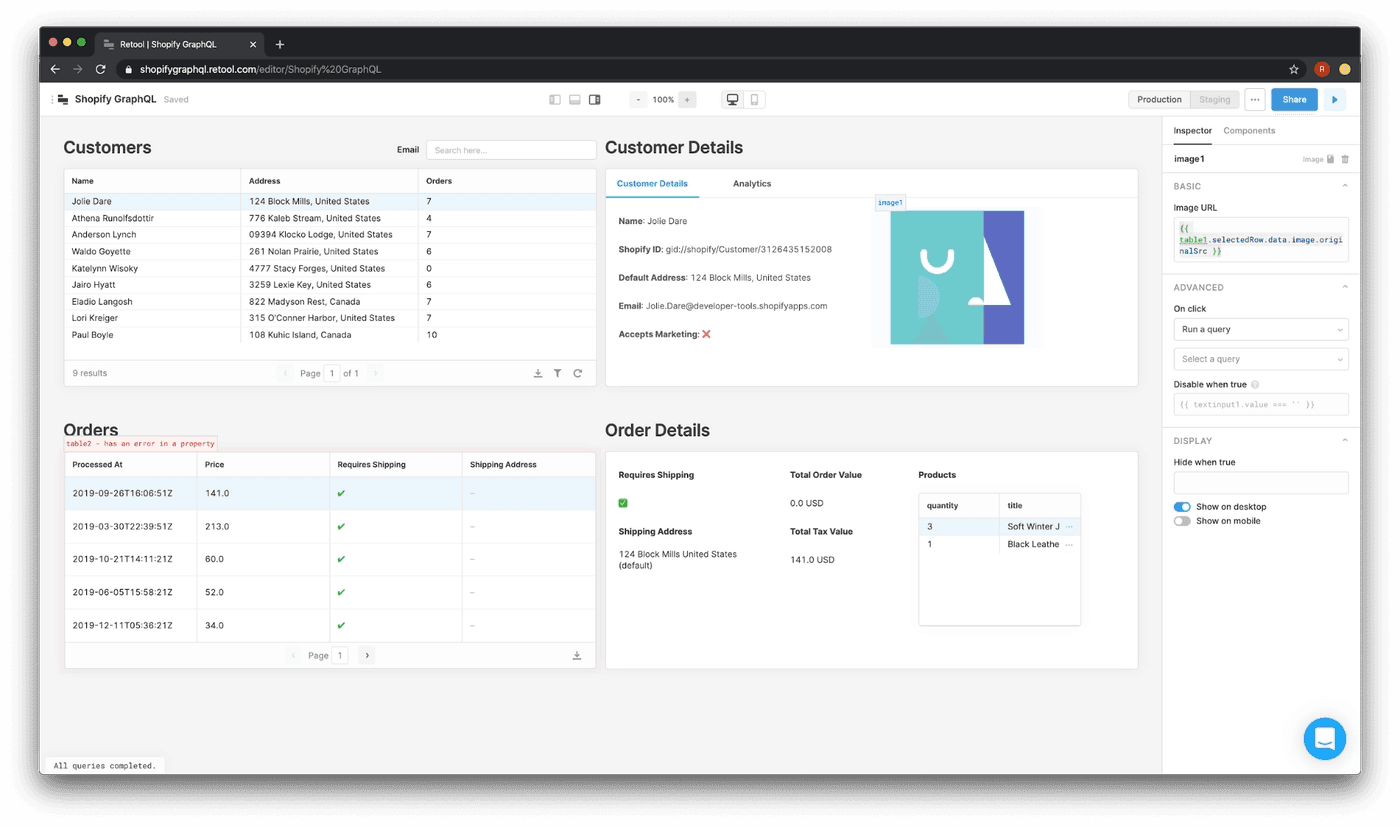
Here’s what the finished product is going to look like:
To get there, here’s what we’ll do:
- Get connected to the Shopify GraphQL API
- Create an app and master query to work with
- Display customer and orders data
- Server side pagination
- Add search
- Add details and analytics
If you’re following along, we should be able to build this fully functional app in under an hour.
See how companies like DoorDash, Brex, and Amazon build customer dashboards in hours with Retool.
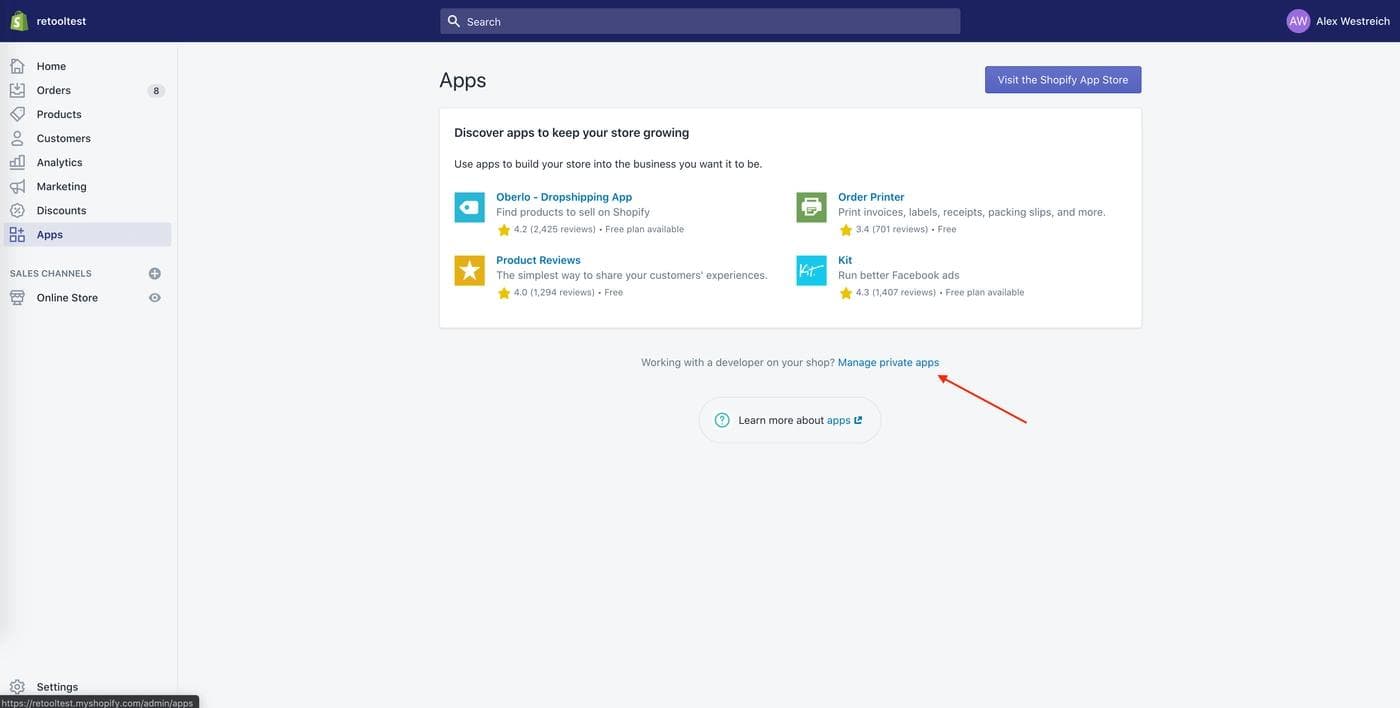
To get started, you’ll need to generate a GraphQL API key from your Shopify Admin page (if you already have an API key you can skip this step). To create the GraphQL API key, open the Shopify Admin page (yourdomain.myshopify.com/admin) and select Apps. At the bottom of the page, hit “Manage Private Apps”, then “Create A New Private App” on the next page.
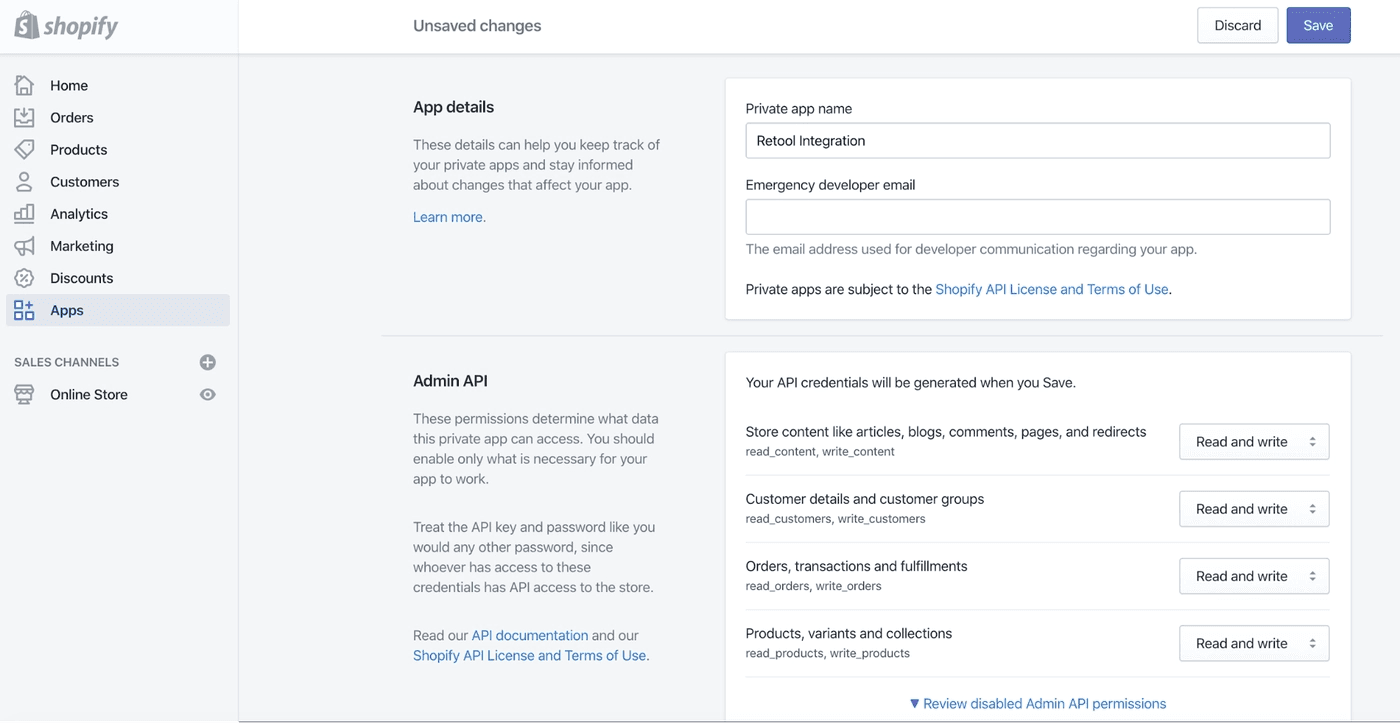
The next page is where you can name the App, and set API access permissions. Let’s give both read and write permissions for each category for this test connection. If you have a specific scope in mind, this is where you could limit it.
Click “save” on the bottom right, and if all goes well, your app will get created and you’ll land on a details page. You should see an API Key and Password in the format: https://{apikey}:{password}@{hostname}/admin/api/{version}/{resource}.json. Shopify stitches them together in the “Example URL” for you to copy, but references the “orders” resource (the URL ends with orders.json). Replace this last part before the .json with graphql: https://{apikey}:{password}@{hostname}/admin/api/{version}/graphql.json.
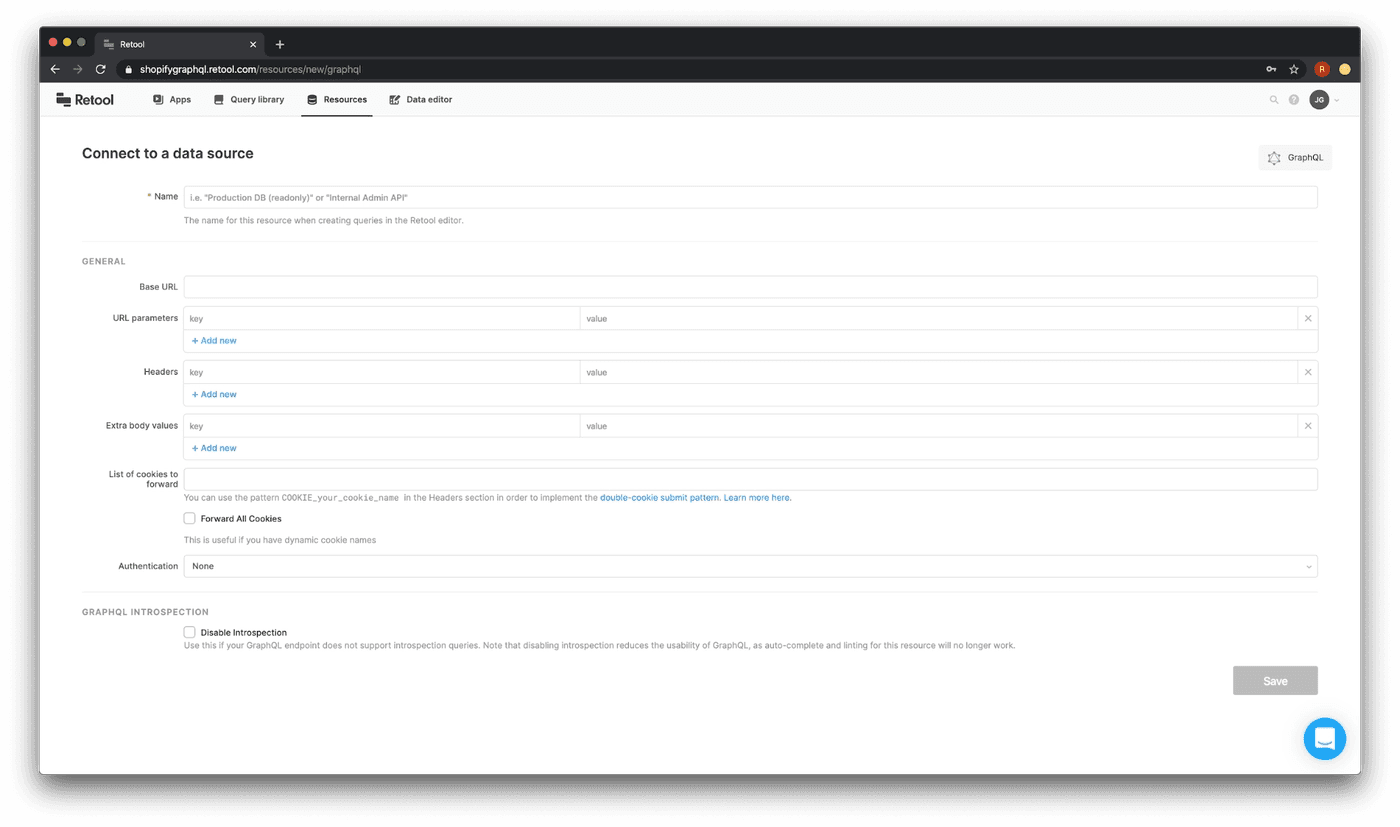
Next, let’s connect your Shopify data to Retool. Head over to Retool and create an account if you haven’t already. If you’re signing up for the first time, you’ll automatically be routed to the screen where you can connect a data source; if you already have an account, navigate to the Resources tab on your home page (yourdomain.retool.com/resources).
Once you’re there, hit the “Create new” button, and select GraphQL from the API section. I’m going to very creatively name this resource ”Shopify Test GraphQL API”. Copy in your https://{apikey}:{password}@{hostname}/admin/api/{version}/graphql.json link as the Base URL and hit “Save”.
If all went well, you should see a confirmation modal. Click “great” and we can get started building. Hopefully, it is indeed great.
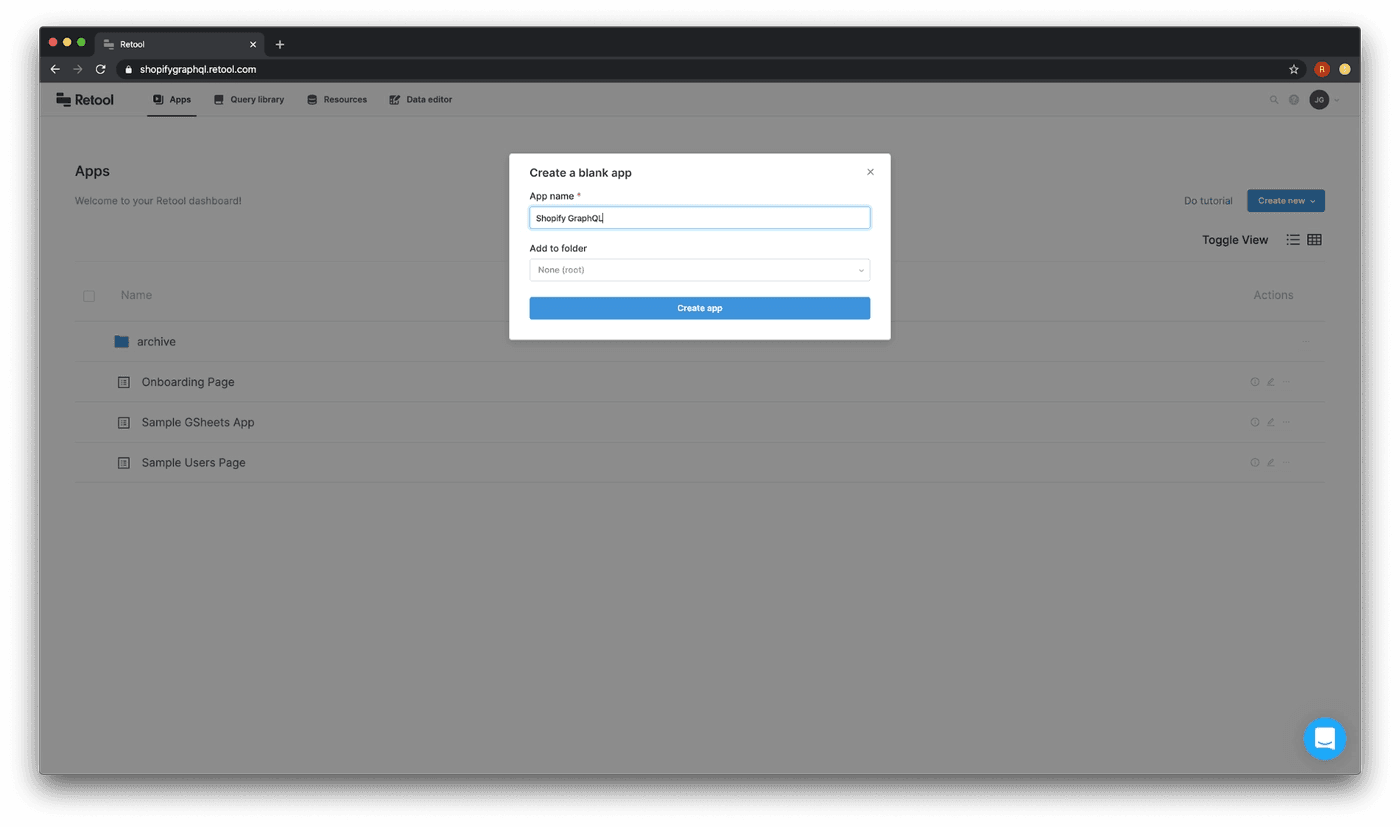
We’ll start by creating a new blank app: click the “Create new” button on the right of your Retool home screen and choose “Create a blank app” from the dropdown. I'm going to name mine “Shopify GraphQL”, but I won’t be offended if you use something more creative.
With our app created, it’s time to start getting the data we need. Normally, we’d configure a bunch of different REST queries to power different parts of a dashboard: but the entire point of GraphQL is to _not _do that, so we’ll create a master query with all the data we need and work with it from there.
Here are the data points we’ll need:
- Customer
- ID
- Display Name
- Image
- Accepts Marketing
- Default Address
- Orders Count
- Orders
- Processed At
- Total Price Set
- Total Tax Set
- Currency Code
- Requires Shipping
- Shipping Address
- Products
- Quantity
- Title
To get started on our query, head over to the bottom of your screen – that’s called the query editor. There should already be a “query 1” created for you with an “onboarding_db” Postgres resource selected. Click on that dropdown and choose the Shopify GraphQL source you just added:
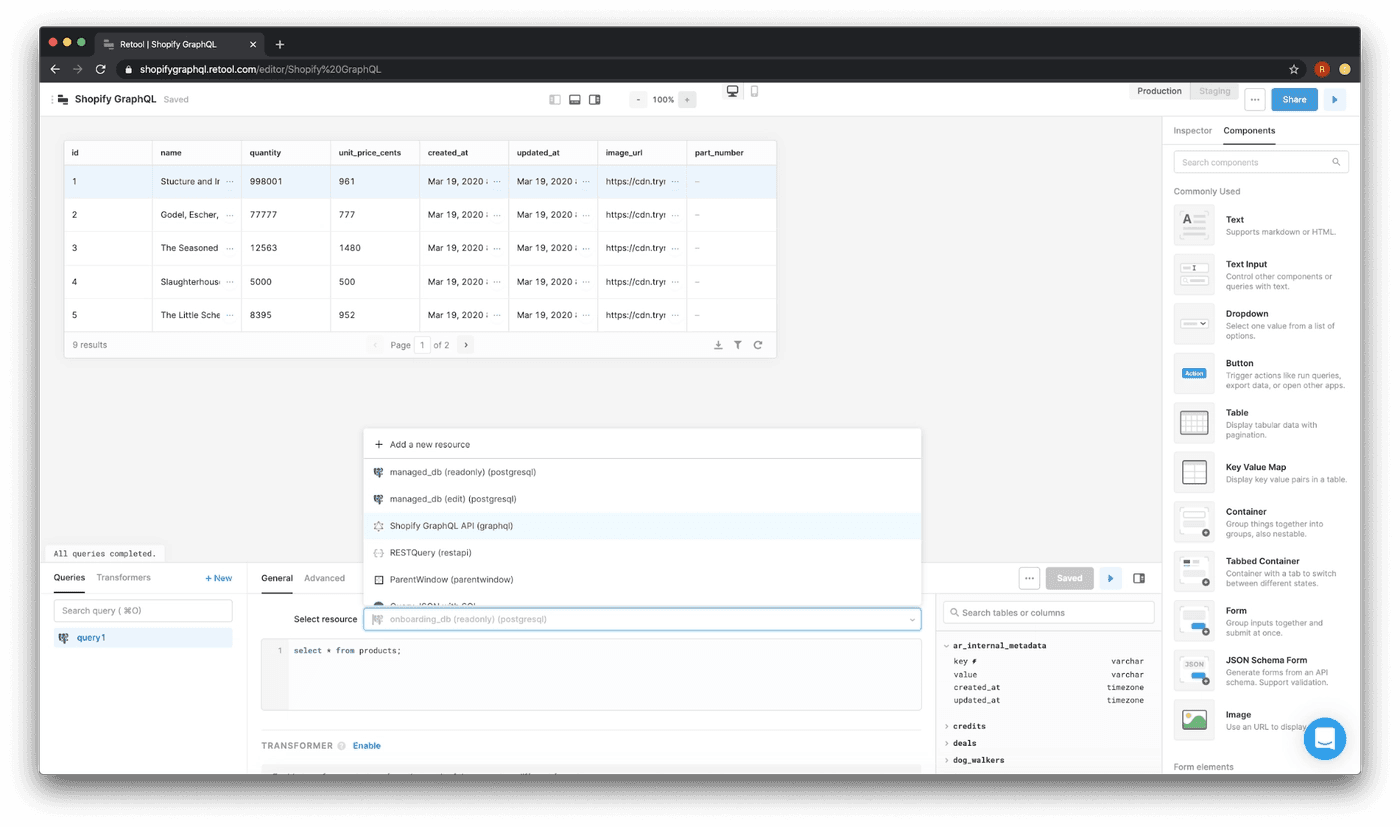
The Retool GraphQL query editor has a handy-dandy schema explorer that will load the fields and data types that our API can return. This will show up automatically as long as the GraphQL resource supports introspection.
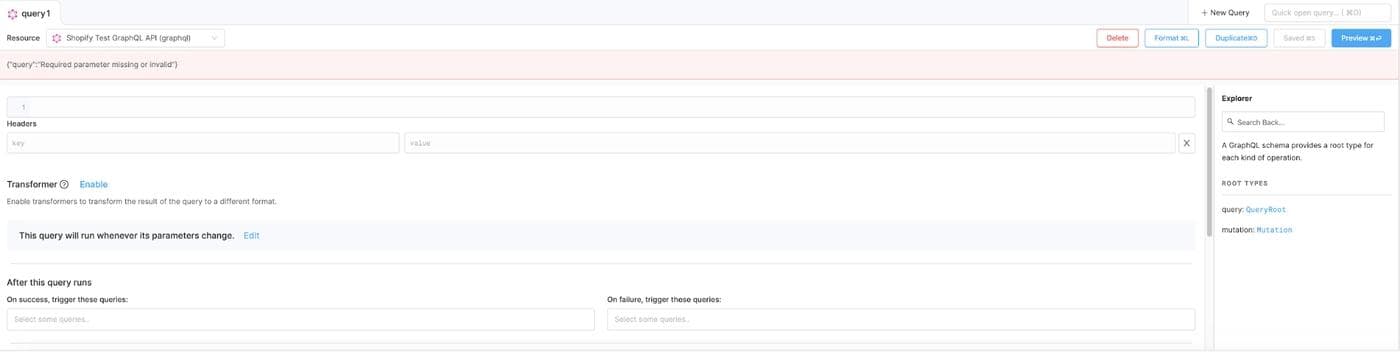
In the schema explorer in the bottom right section of the query builder, let’s click on QueryRoot to see what read information the Shopify Test GraphQL API is prepared to give us. Oh, wow. There is a TON. Whenever you’re ready to work on other features, you can check out the Shopify GraphQL API Reference.
For now, let’s search in the Explorer back in Retool for QueryRoot.customers. If you click on the “customer” part of the link it will show that this is of the CustomerConnection! Type, and list the arguments that this query can take inside of the parentheses in customer().
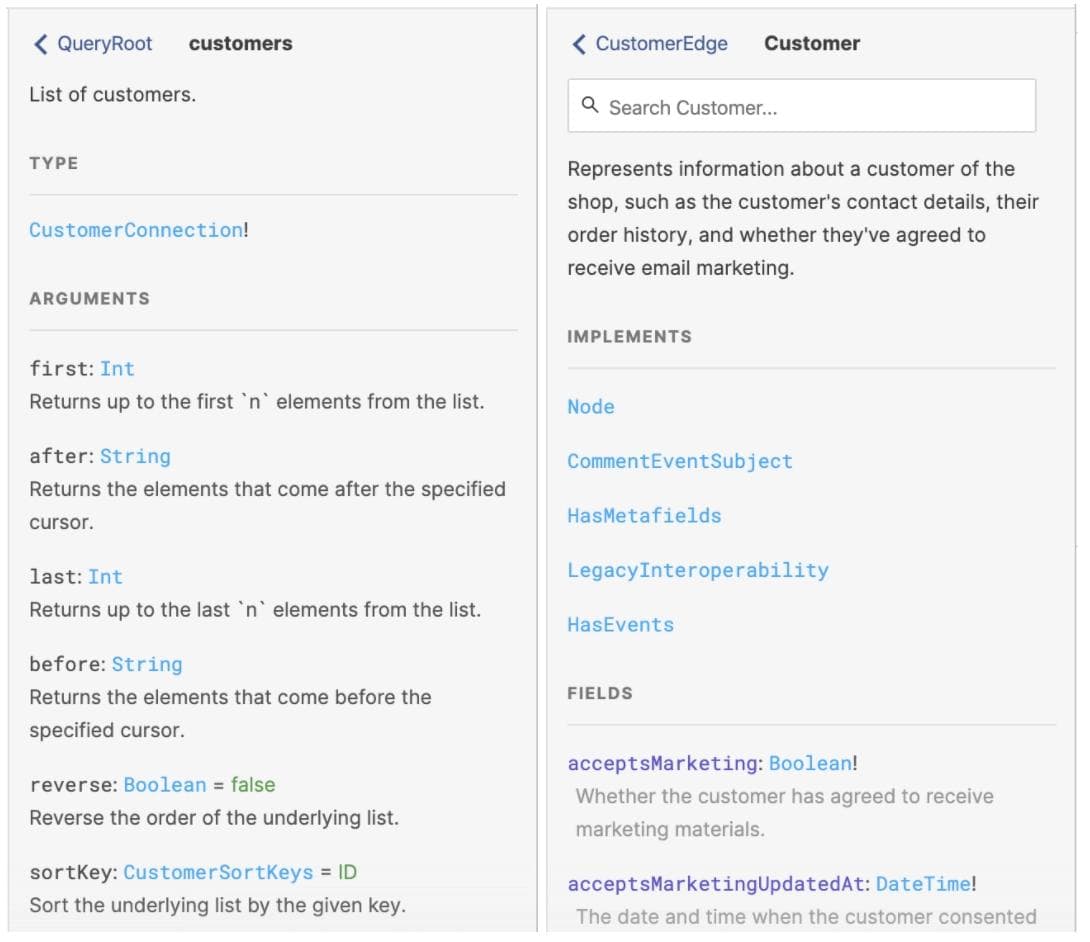
For our query, Shopify requires you to limit the amount of requests for multiple objects using either the “first” or “last” argument. For this app, we’ll start with a limit of returning the first 5 customers and go through setting up server side pagination later.
It’s worth noting that Shopify rations the size of the possible query return, so if there are too many images or keys that could be large you’ll get an error saying:
"Query has a cost of XXXX, which exceeds the max cost of 1000"
We’ll try to keep our queries small enough to stay within the limit.
Here’s the query we’re going to use to retrieve all of the fields we need. We’ll walk through it piece by piece:
1 2 3 4 5 6 7 8 9 10 11 12 13 14 15 16 17 18 19 20 21 22 23 24 25 26 27 28 29 30 31 32 33 34 35 36 37 38 39 40 41 42 43 44 45 46 47 48 49 50 51 52 53 54 55 56 57 58 59 60 61 62query { customers(first: 5) { edges { node { id displayName image { originalSrc } email acceptsMarketing defaultAddress { name address1 address2 city province country zip } ordersCount orders(first: 5) { edges { node { processedAt totalPriceSet { shopMoney { amount } } totalTaxSet { shopMoney { amount } } currencyCode requiresShipping shippingAddress { name address1 address2 city province country zip } lineItems (first: 5) { edges { node { quantity title } } } } } } } } } }
To start out, we’ve included no GraphQL variables – we’ll add some later when we work on pagination. Let’s run through this bit by bit:
1 2 3 4 5 6 7 8 9 10 11 12 13 14 15 16 17 18 19 20 21customers(first: 5) { edges { cursor node { id displayName image { originalSrc } email acceptsMarketing defaultAddress { name address1 address2 city province country zip } ordersCount
Shopify’s GraphQL API is organized as a graph, so each element of data is a node connected by edges. To get a group of nodes, you start with the query root (query), put in your connection type (customer), and then edges. Our query asks for the node of each edge of the customer object: that’s where you nest the actual fields that you want returned. The first: 5 filter gives us the first 5 customers → we’ll update this to do full pagination in just a bit (that’s why cursor is in there). Here, we’re grabbing:
- id
- displayName
- image → originalSrc
- acceptsMarketing
- defaultAddress → name, address1, address2, city, province, country, zip
- ordersCount
Next, we get the data we need about a customer’s individual orders:
1 2 3 4 5 6 7 8 9 10 11 12 13 14 15 16 17 18 19 20 21 22 23 24 25orders(first: 5) { edges { node { processedAt totalPriceSet { shopMoney { amount } } totalTaxSet { shopMoney { amount } } currencyCode requiresShipping shippingAddress { name address1 address2 city province country zip }
We’re following the same structure (edges → node) and grabbing these fields for each order:
- processedAt
- totalPriceSet → amount
- totalTaxSet → amount
- currencyCode
- requiresShipping
- shippingAddress → name, address1, address2, city, province, country, zip
You’ll notice we didn’t get the _cursor _field here: if we wanted to paginate these orders, we would use cursor, but for simplicity we’ll skip that and add (first: 5) to the orders root. That gives us the user's first 5 orders.
Finally, we’ll grab the line items (products) for each order. Let’s use the same _(first: 5) _here for simplicity.
1 2 3 4 5 6 7 8lineItems (first: 5) { edges { node { quantity title } } }
We’re pulling just two fields: quantity and title.
If all of this makes sense (and even if it doesn’t), paste it into the “Query” field in the query editor and click “Save.” Because we haven’t included any variables yet, the editor doesn’t show anywhere to define them.
Finally, let’s rename this query something slightly more useful than query1 – getCustomers. Here’s what things should look like at this point:

With the basics of the query written, we can get started building!
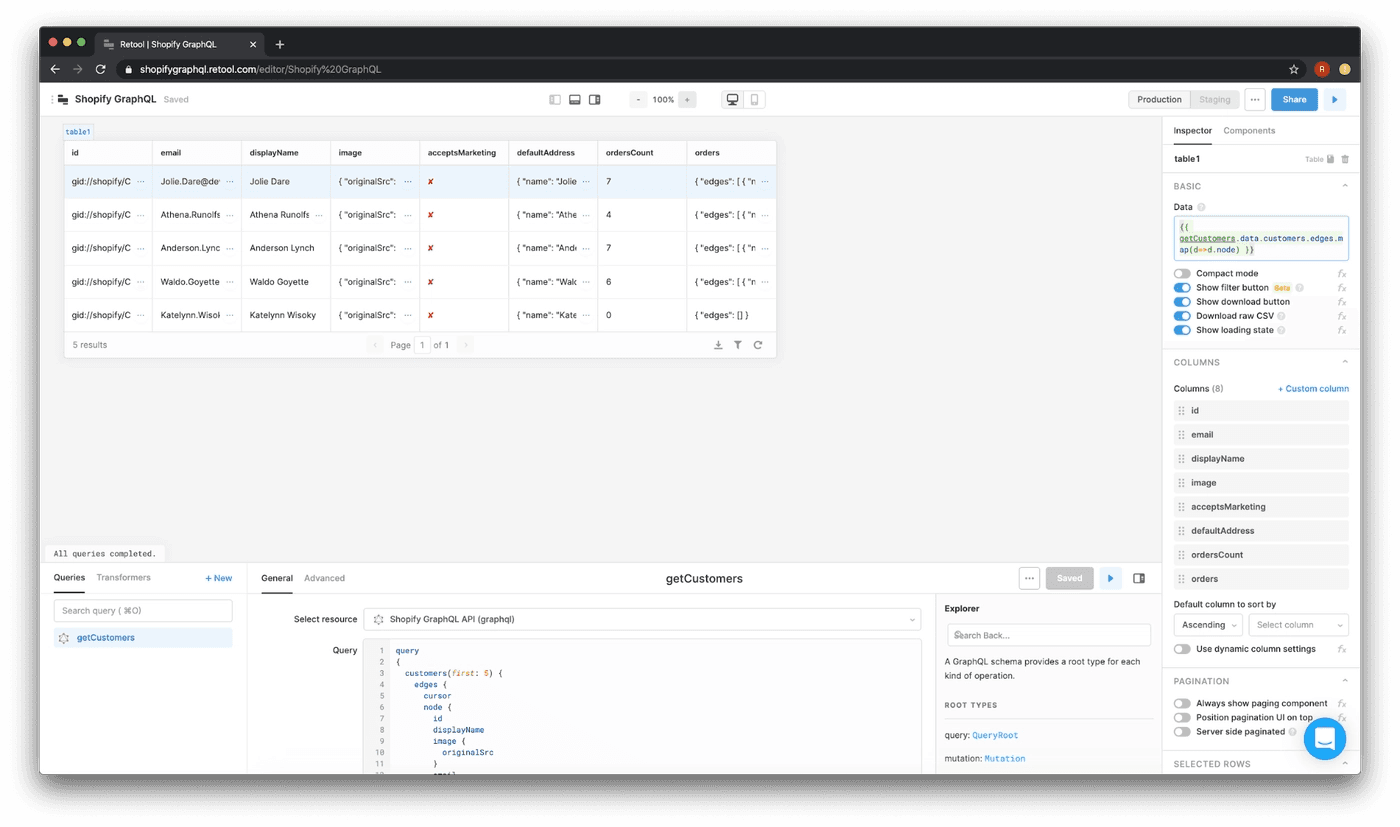
Your “blank” Retool app starts with a table, which is convenient because we need one! Let’s start by getting our customer data into that table. Click on the table component, and head over to the component inspector in the right sidebar. In the “data” field, reference the results of the query we just wrote:
{{ getCustomers.data.customers.edges.map(d=>d.node) }}
The .map function lets you apply a function to each item in an array: we’re getting the “node” property of each customer edge, which should populate our table in the format we need.
There are a few things you’ll want to do to get this table looking a bit better:
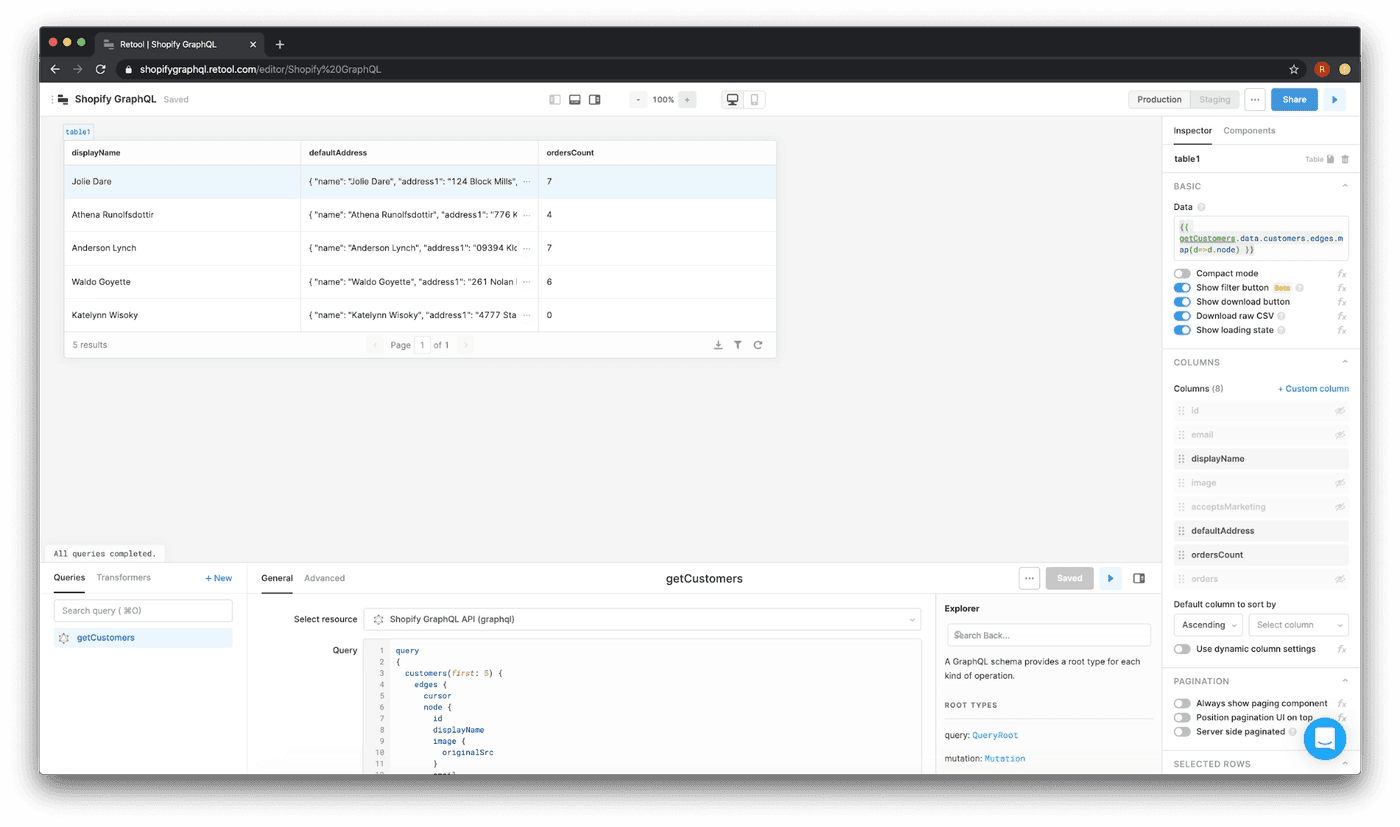
- Hide extra columns
Most of the columns in the table aren’t particularly useful. You can hide columns by clicking on the table component and using the “Columns” section in the right sidebar. As you mouse over each column, you’ll see a little eye icon that you can click to hide the column in the table.

I’ve hidden everything except displayName, defaultAddress, and ordersCount.
- Change column names
Let’s change the table column names to be a bit more human readable. Head back to the right sidebar by clicking on the table, and scroll down to the “columns” section. Clicking on a column opens a menu that allows you to change the name:
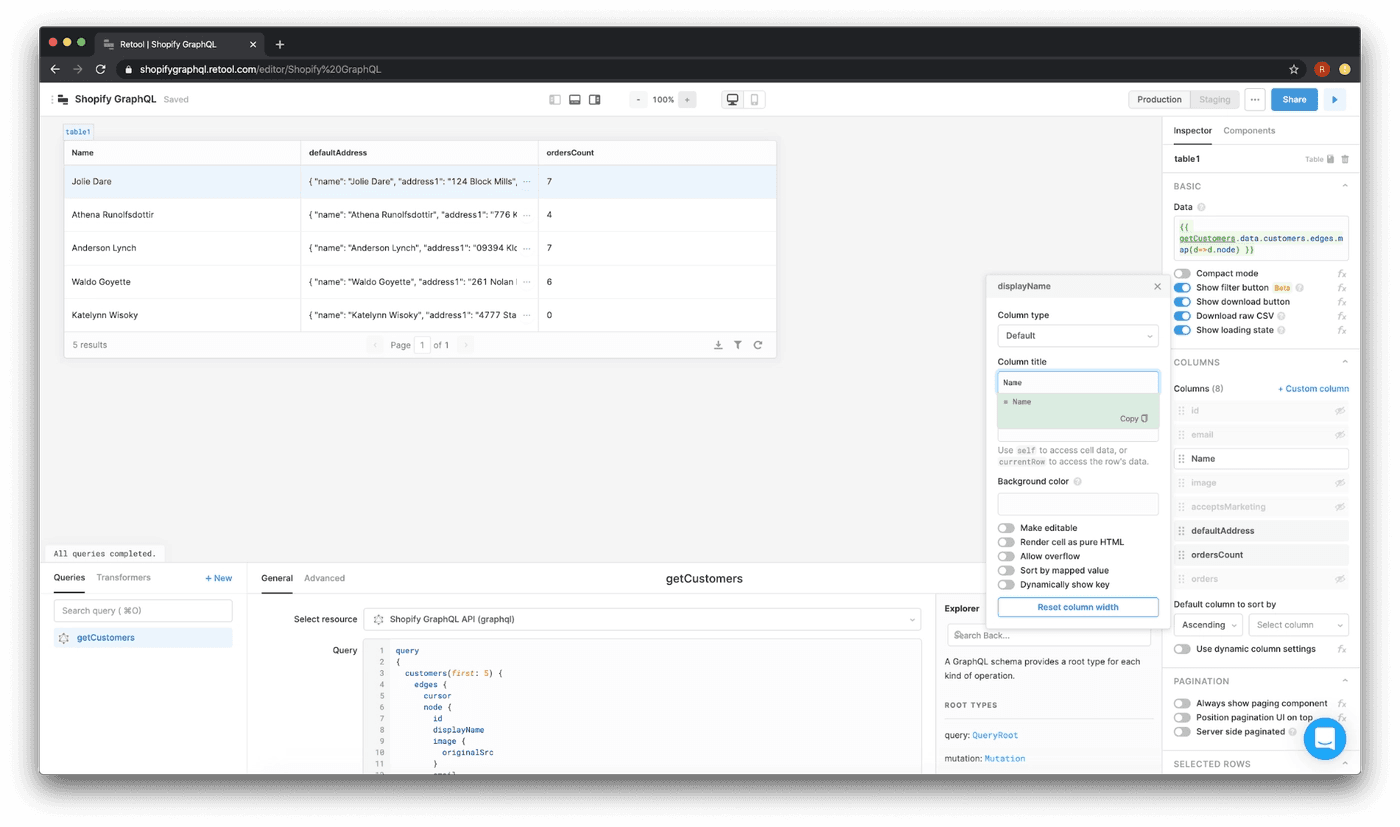
I changed “displayName” to Name, “defaultAddress” to Address, and “ordersCount” to Orders. Here’s how things should look:
- Parse nested fields
The Address column is a group of nested fields, so they appear as JSON in the table: we can use Column Mappers to extract the fields we need. Our sample Shopify data is pretty sparse on the address side, so all we have is address and country (your data will have more!). Click on the address column in the right sidebar and fill out the Mapper field:
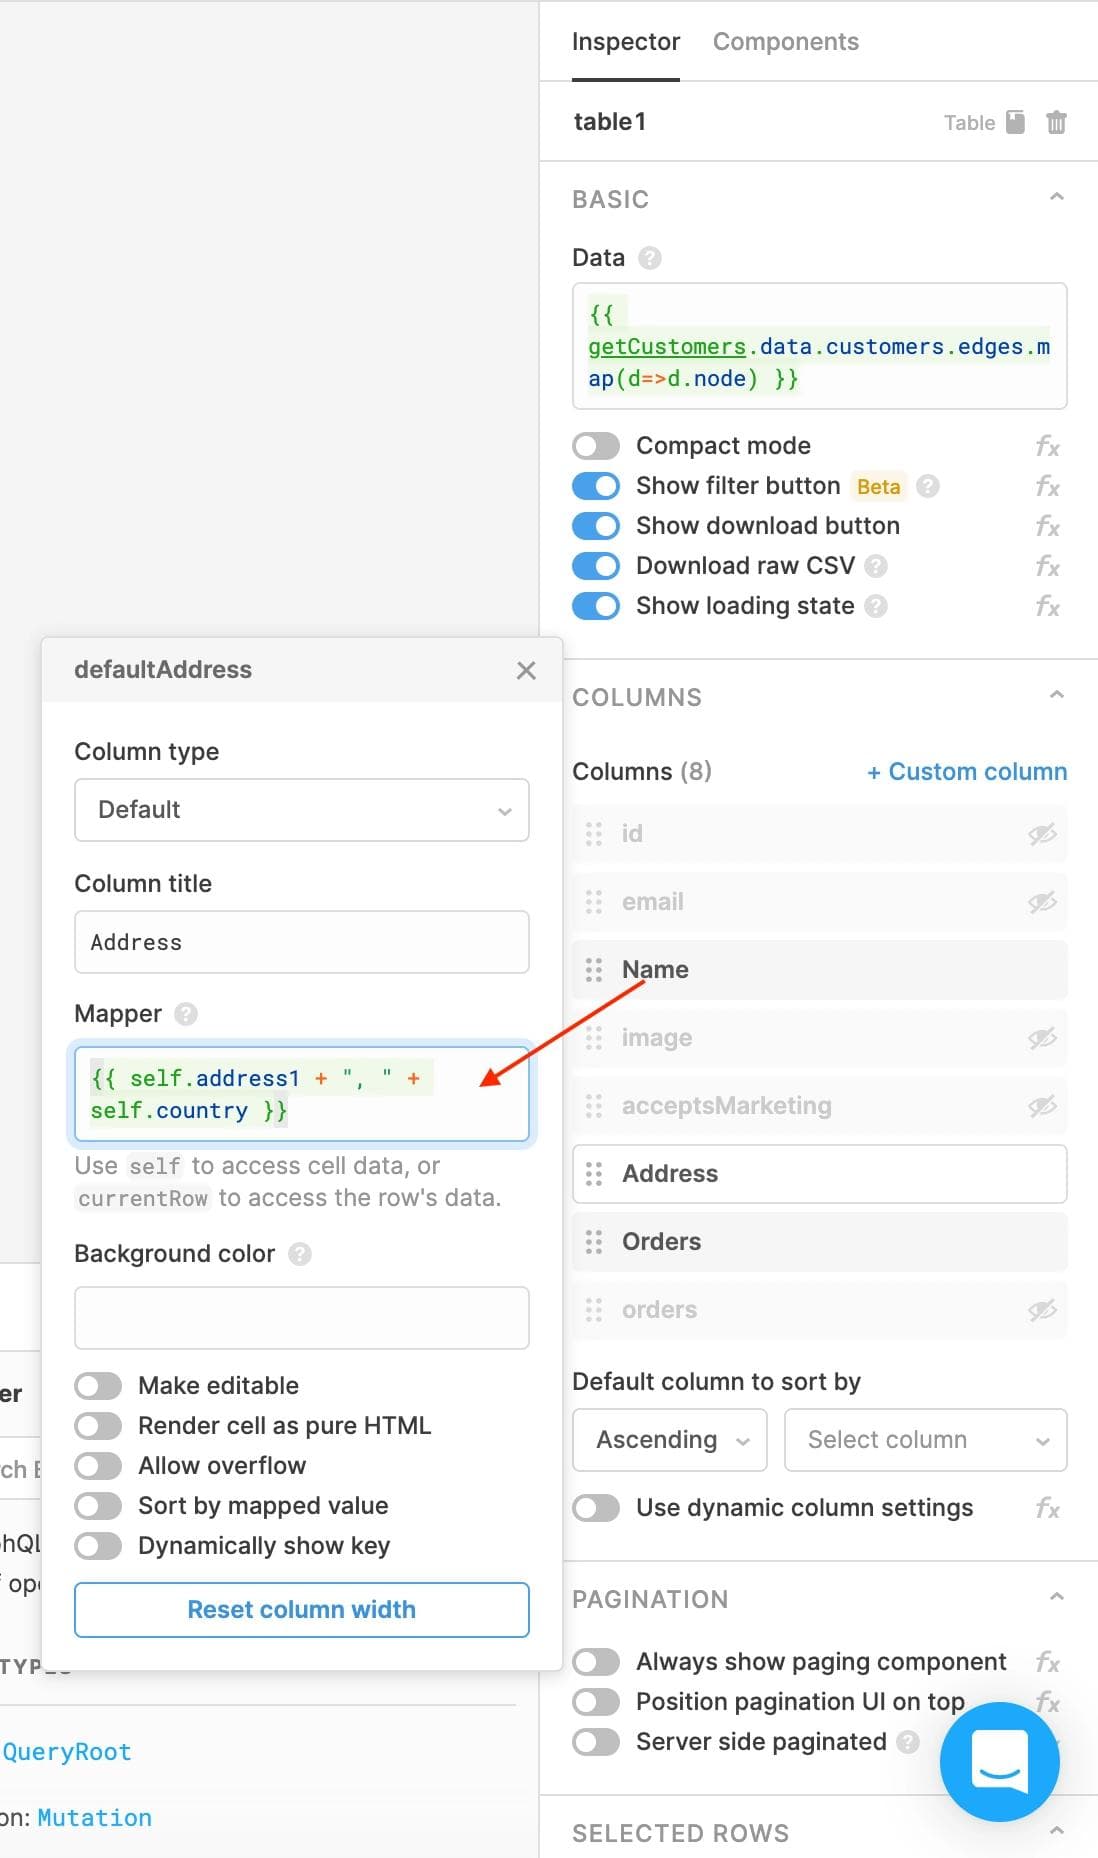
In a Column Mapper, you can use self to reference cell data and pull out the nested fields you need. Here, we’re concatenating the address1 and country fields, but you can use any other address fields you want; the original query pulls in quite a few.
{{ self.address1 + ", " + self.country }}
Let’s also drag a text component on top of the table. We’ll use ## Customers in the “value” field (remember: click on any component to see and work with its properties).
For ease of navigation, let’s do one last thing: enable “compact mode” for the customers table. You can do that by clicking on the customers table and turning on the “compact mode” toggle in the right sidebar.
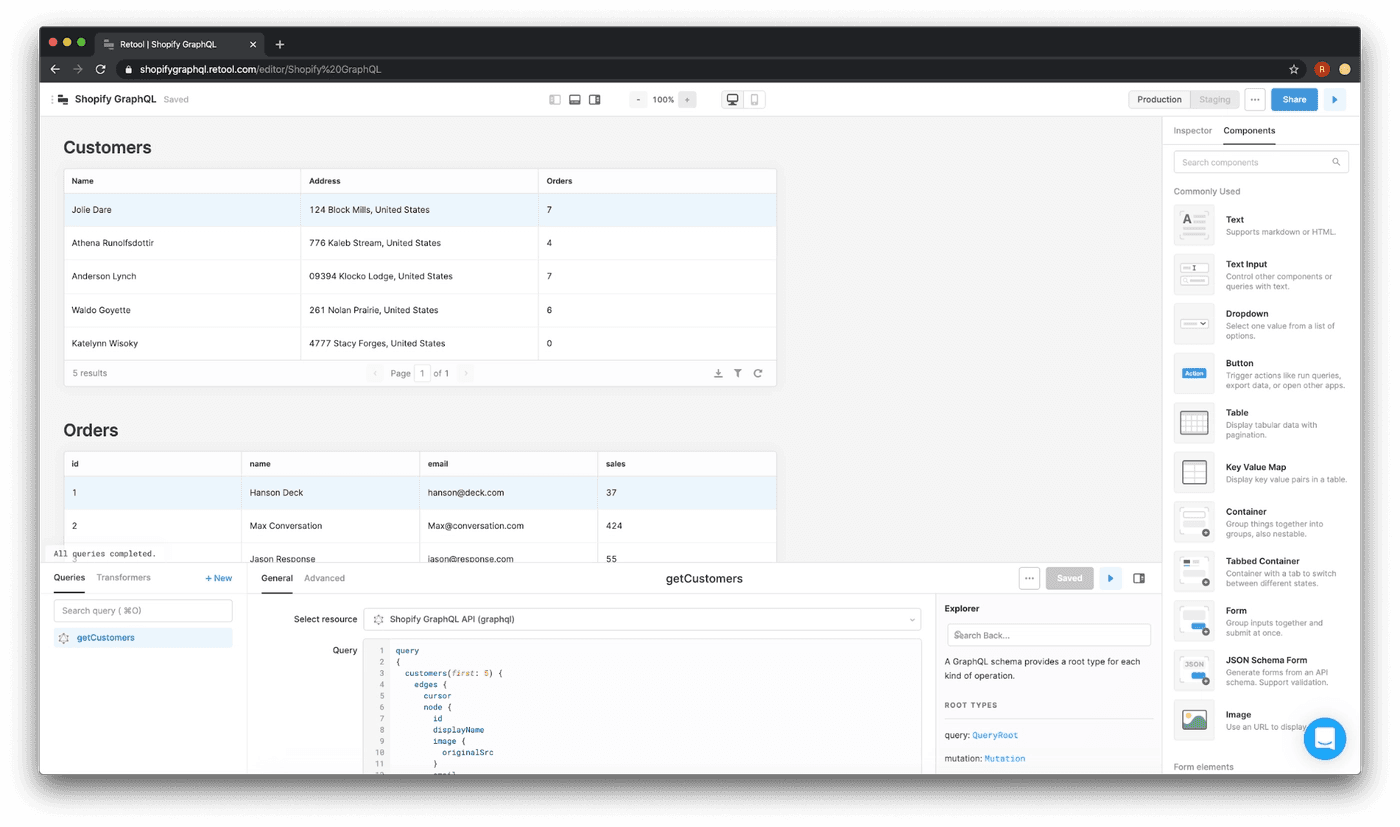
Now that we’ve got our customers table in order, let’s move on to creating an orders table that displays an individual customer’s orders. Right below, drag a new table component onto the canvas. Put a text component above that (value: ##orders) as well so we know which table is which.
We want the lower table to show the orders of whichever customer (row) is selected in the top table. We can do that with the .selectedRow property. Click on the orders table, and in the “data” field, paste this in:
{{ table1.selectedRow.data.orders.edges.map(d => d.node) }}
This little bit of Javascript references the “orders” cell in the selected row in the customers table, and does the same mapping to get nodes as in the customers table, too. Let’s follow the same steps we did with the customers table: clean up column names, hide things we don’t need, and map out nested columns.
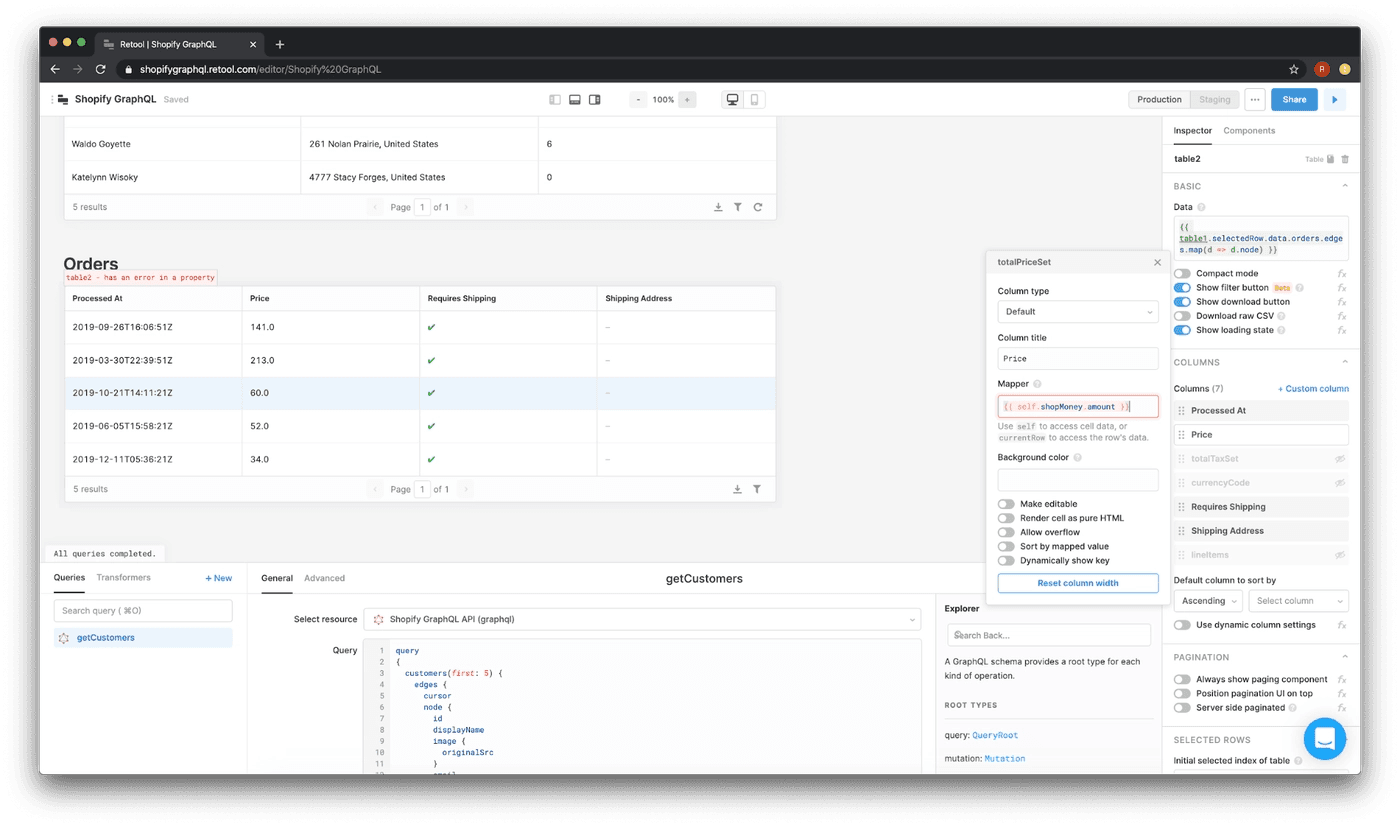
To start, I kept only a few columns and renamed them (Processed At, Price, Requires Shipping, Shipping Address). And to turn the JSON in the Price column into an actual order price, we’ll use column mappers again. This time, there are two levels of nesting:
{{ self.shopMoney.amount }}
Column mappers are still a bit buggy, so you might see an error message or need to refresh the page to see your results.
If everything is set up correctly, clicking on a different row in the customers table should update the data you’re seeing in the orders table.
We hardcoded a (first: 5) into our GraphQL query, but we’re going to want to be able to look at more than just our first five customers. Retool tables make it easy to paginate server side so that each table page displays a set amount of customers. For more context, check out our docs.
To server side paginate, we’ll need to do 3 things: update our query, add cursor variables, and update our table.
- Update our query
Let’s replace the (first: 5) filter with this:
(first: $first, last: $last, after: $afterPage, before: $beforePage)
These variables will let us dynamically set how many customers we want to query, and which “page” of them we want to display. You can read more about these 4 variables in the Shopify docs here.
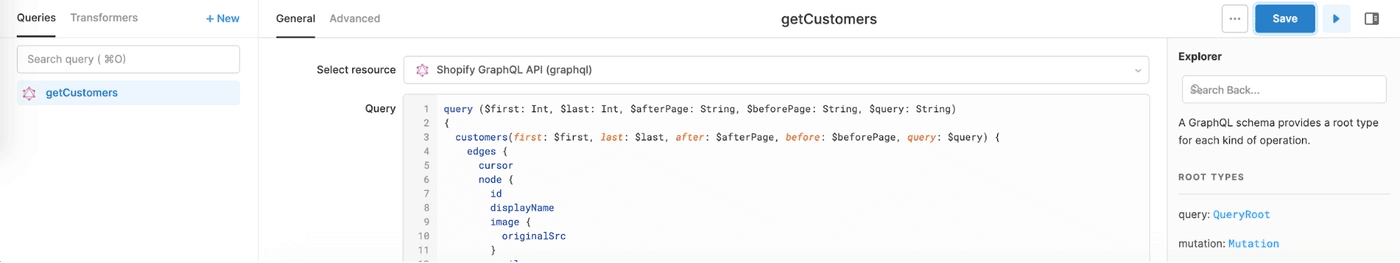
And as with all GraphQL variables, they need to be declared in the query root as well. You’ll need to add this next to the query keyword:
($first: Int, $last: Int, $afterPage: String, $beforePage: String)
Here’s what the first few lines of your query should now look like:
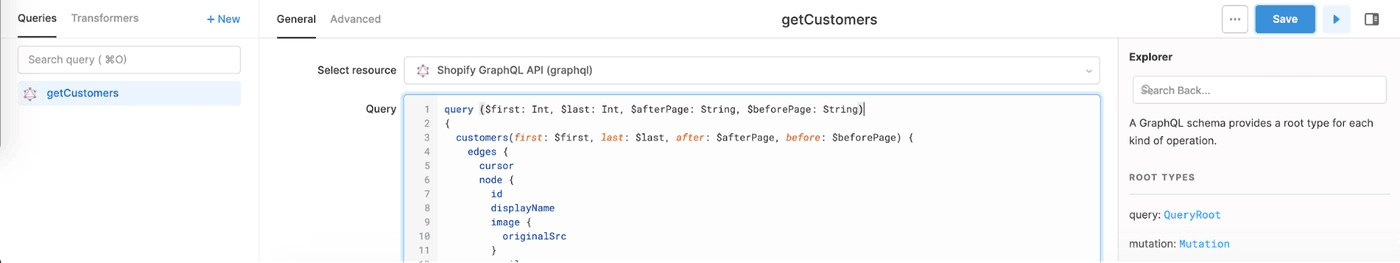
Now that we’ve added variables to our GraphQL query, a “variables” section should appear in your query editor – this is where we’ll set the value of these variables.
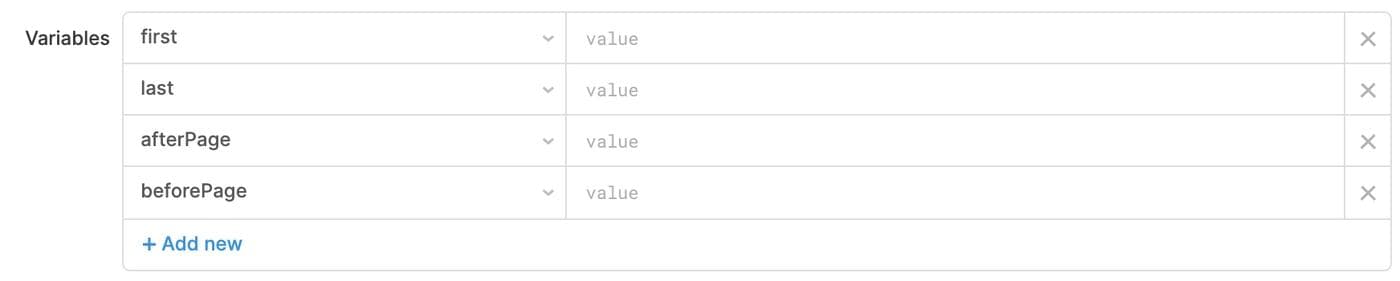
Let’s fill them in!
- Add cursor variables
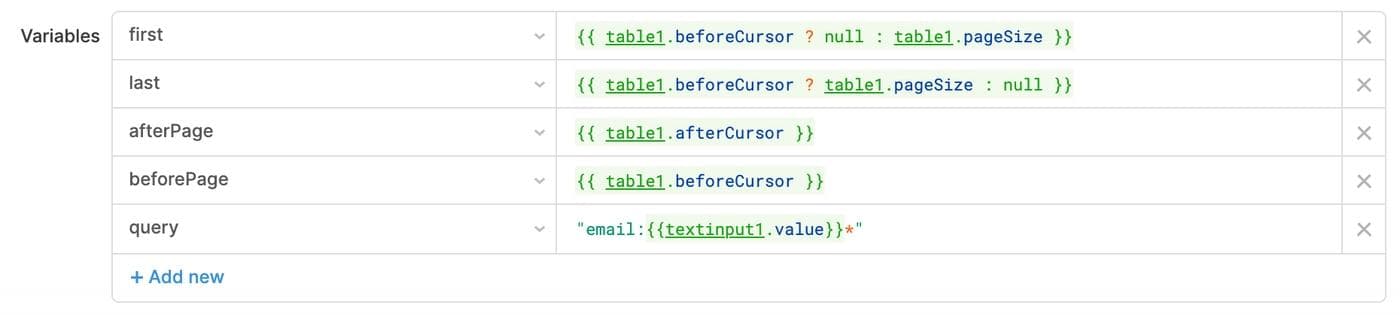
Retool tables provide properties for pagination that you can reference in your variables. Here’s what we’ll use:
- first:
{{ table1.beforeCursor ? null : table1.pageSize }} - last:
{{ table1.beforeCursor ? table1.pageSize : null }} - afterPage:
{{ table1.afterCursor }} - beforePage:
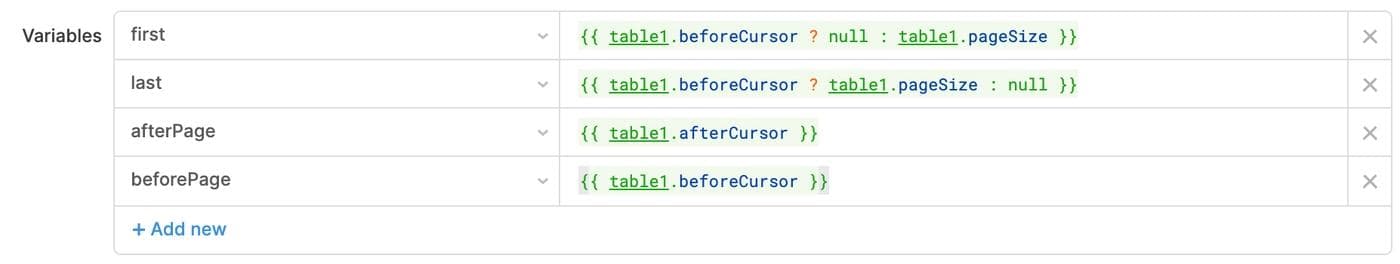
{{ table1.beforeCursor }}
Cursors are part of a GraphQL spec for pagination that indicates when there are previous and following results to include. These little Javascript snippets are dynamically choosing how many and which customers to return based on which page the Retool table is currently on. For a bit more detail, check out our docs on the topic.
Here’s what your variables section should look like:
Make sure to save your query!
- Update our table
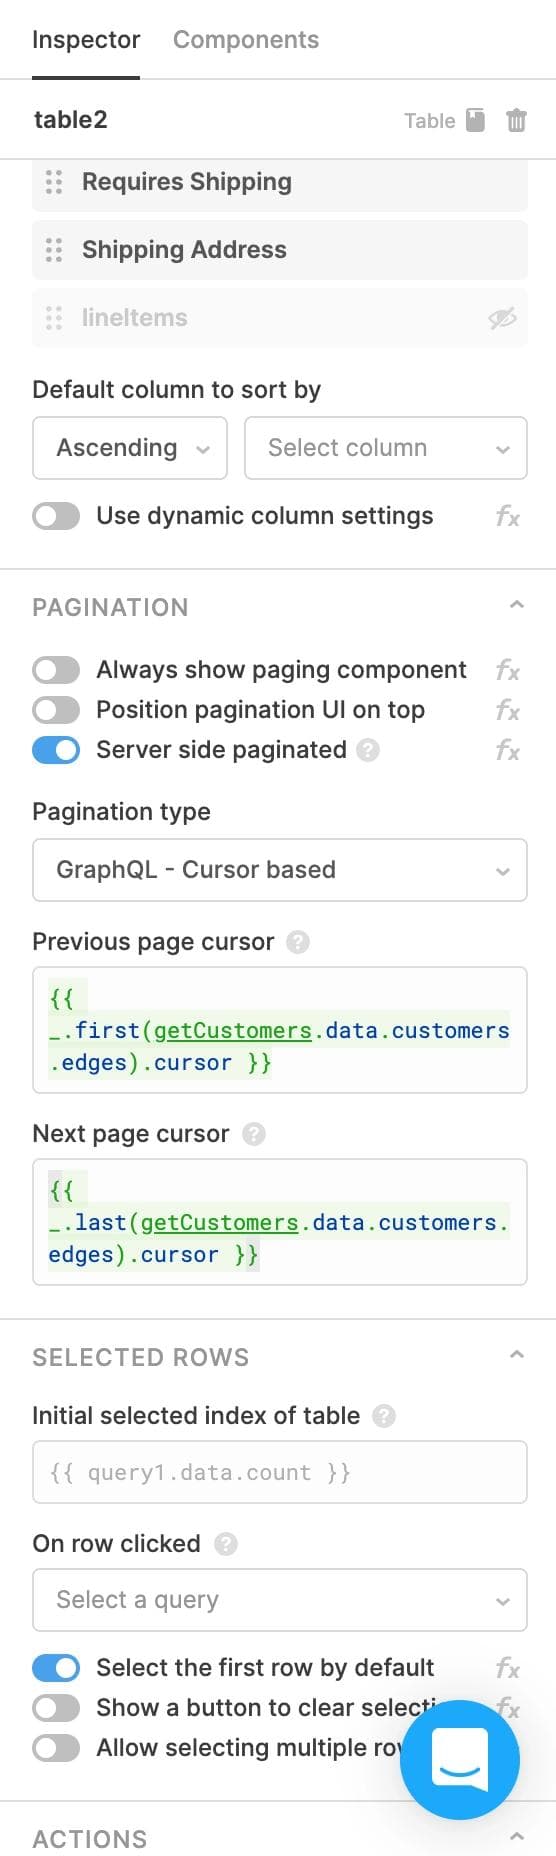
Finally, click on the customers table: we’ll update it to allow for server side pagination. In the right sidebar, there’s a “Pagination” section: toggle the “Server side paginated” to on and select “GraphQL - Cursor based” option from the dropdown. You should see two form fields: “Previous page cursor” and “Next page cursor.” Here’s what we’ll fill in:
- Previous page cursor:
{{ _.first(getCustomers.data.customers.edges).cursor }} - Next page cursor:
{{ _.last(getCustomers.data.customers.edges).cursor }}
We’re using the _.first and _.last functions from Lodash to find the first and last cursors for each edge in our GraphQL query. Here’s what the whole section should look like:
Congrats! The customers table is new server side paginated. Clicking on the “next” arrow in the table will trigger the GraphQL query and get the next page of results from the server.
Here’s what your app should look like thus far:
Let’s add a search bar to our customers table so we can easily find the customers we need. Start by dragging a text input component onto the canvas right above the customers table. The Shopify GraphQL API doesn’t allow search by name, so we’ll need to use email; let’s update the text input “label” field accordingly.
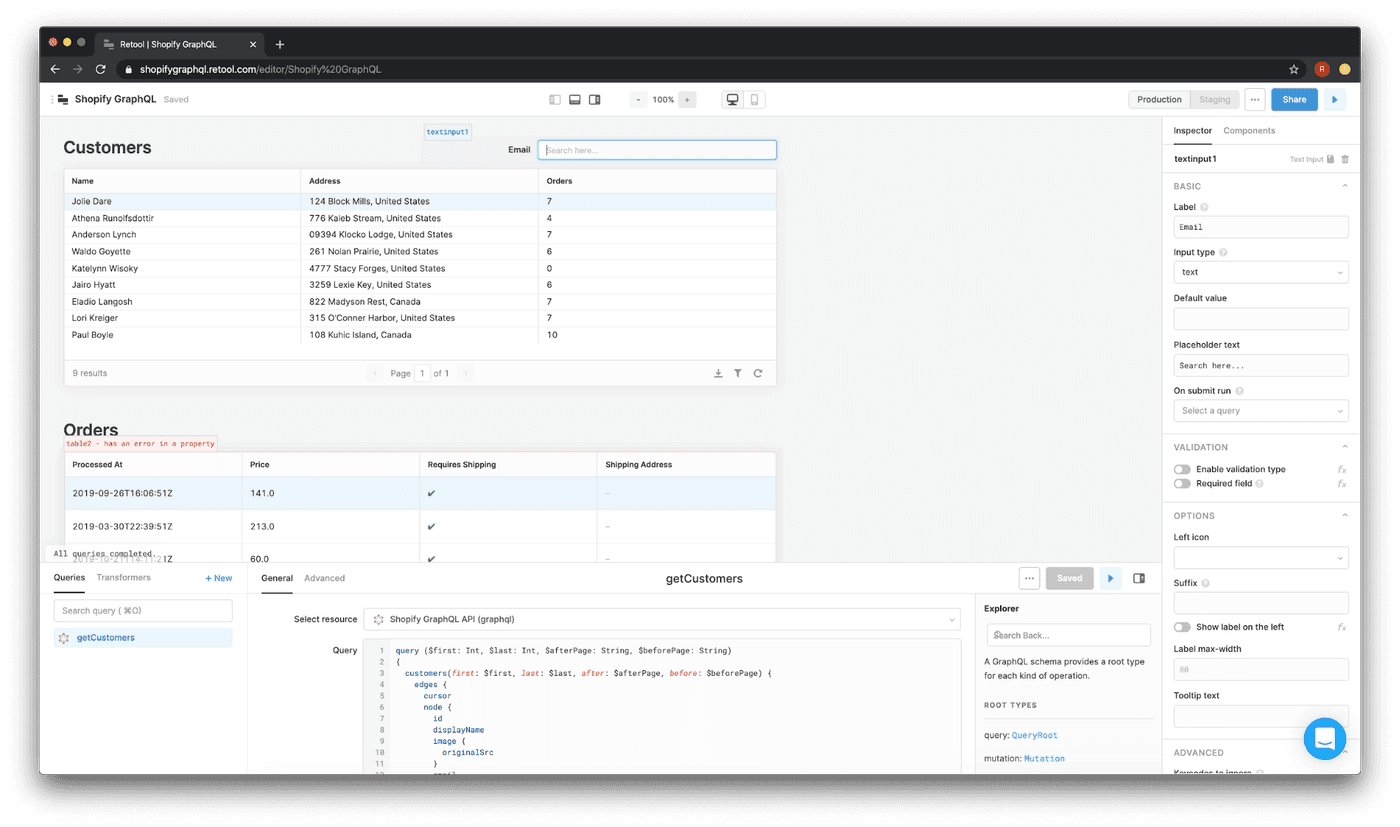
Now we’ll update our getCustomers query to get it connected to the text input component. Let’s add in one more GraphQL variable – query – to the query root and the customers field:
Before saving the query, scroll down to the “variables” section, and you should see a new field for the “query” variable. You might want to brush up on Shopify’s GraphQL query syntax a little bit before running through this part, but long story short, a query for the email field looks like this: query: email:justin*. This will search for any email address that starts with the word justin.
Head to that “query” field and add in this line of Javascript: "email:{{textinput1.value}}*". This transposes the value of the text input box into the right query format. When the text input box is empty, the query will just return all customers. The entire variables section of your getCustomers query should look like this:
Everything should be set! To test it out, try typing a letter into the text input and see what happens.
Home stretch! Let’s add in two containers with some more details on the data we’re looking at. To start, make some space for new components by narrowing the two tables we have on the canvas a little bit. Here’s how things should look:
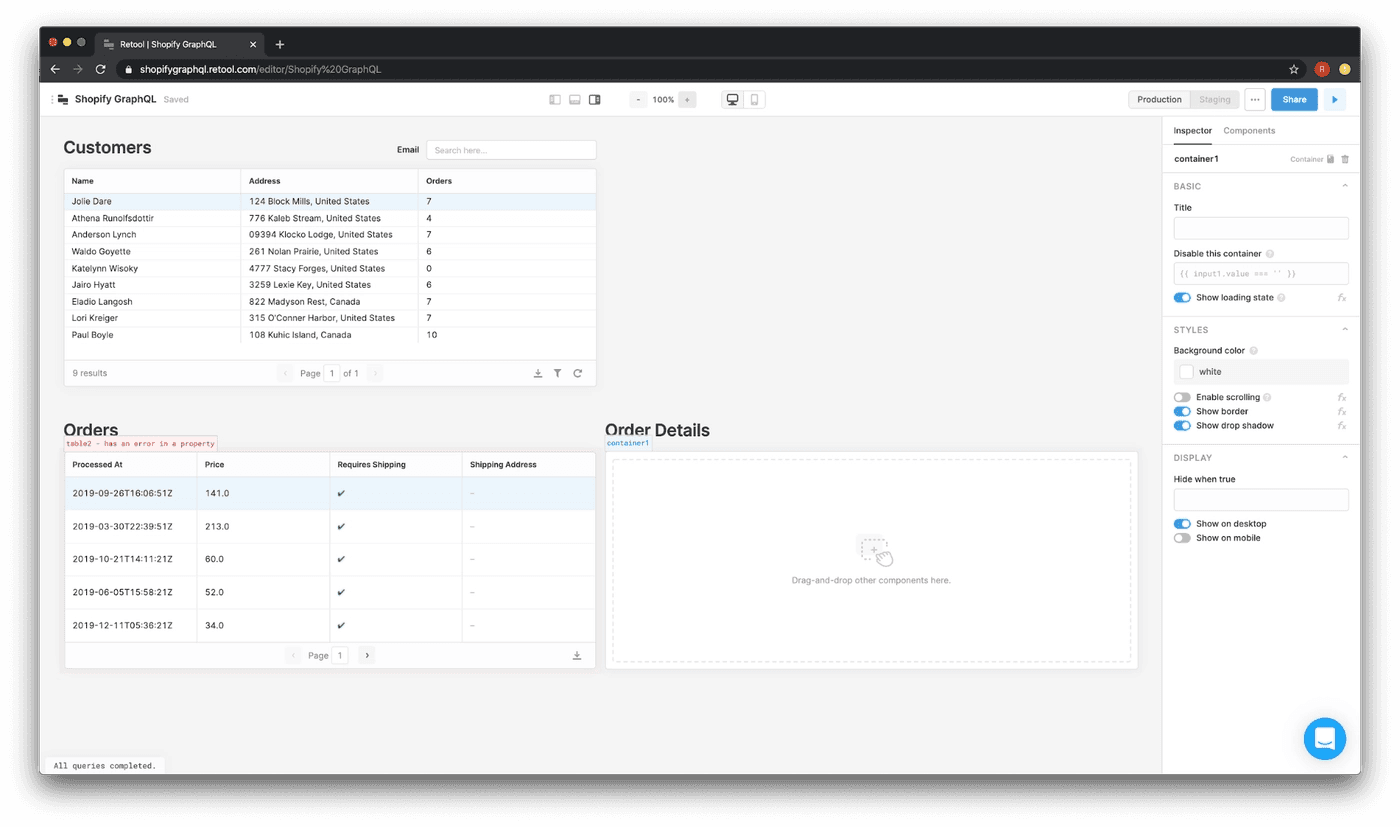
Simplest first: let’s start at the bottom by dragging a container component next to our orders table. A container component is just a container for a bunch of other components. I’ve also added a text component on top and labeled it “Order Details.”
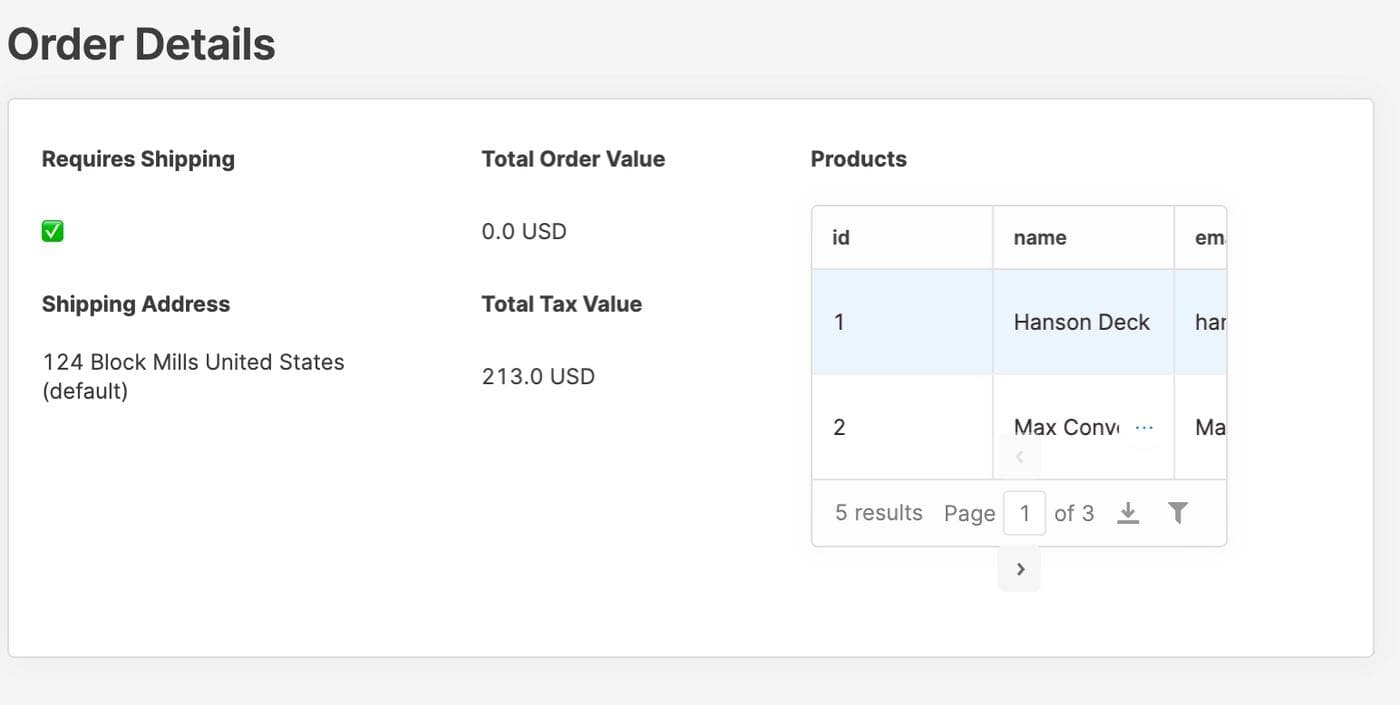
We’re going to add a bunch of text components into the container to see more details about the currently selected row in the orders table. Just like above, we’ll reference these using table2.selectedRow.data…. Start with 4 text components as headers:
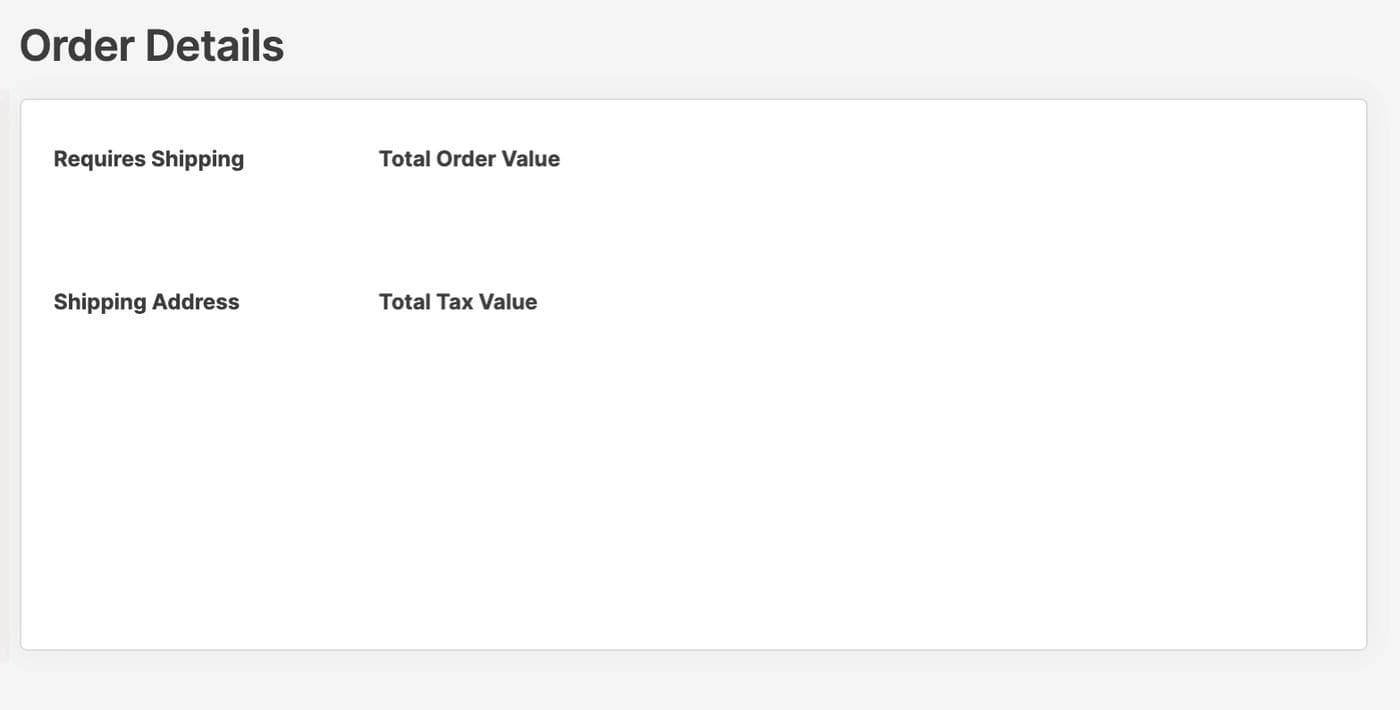
Under each, we’ll drag on another text component. Here’s what we’ll put in each of them:
- Below Requires Shipping:
{{ (table2.selectedRow.data.requiresShipping == true) ? "✅" : "❌" }}
Shows a check if the order requires shipping, and an x if it doesn’t.
- Below Shipping Address:
{{ (table2.selectedRow.data.shippingAddress === null) ? table1.selectedRow.data.defaultAddress.address1 + " " + table1.selectedRow.data.defaultAddress.country + " (default)" : table2.selectedRow.data.shippingAddress }}
Shows the concatenated shipping address if it exists, and the customer’s default address if no shipping address is attached to the order.
- Below Total Order Value:
{{ table2.selectedRow.data.totalPriceSet.shopMoney.amount + " " + table2.selectedRow.data.currencyCode}}
Shows total order value concatenated with the order’s currency code.
- Below Total Tax Value:
{{ table2.selectedRow.data.totalTaxSet.shopMoney.amount + " " + table2.selectedRow.data.currencyCode}}
Shows total tax value concatenated with the order’s currency code.
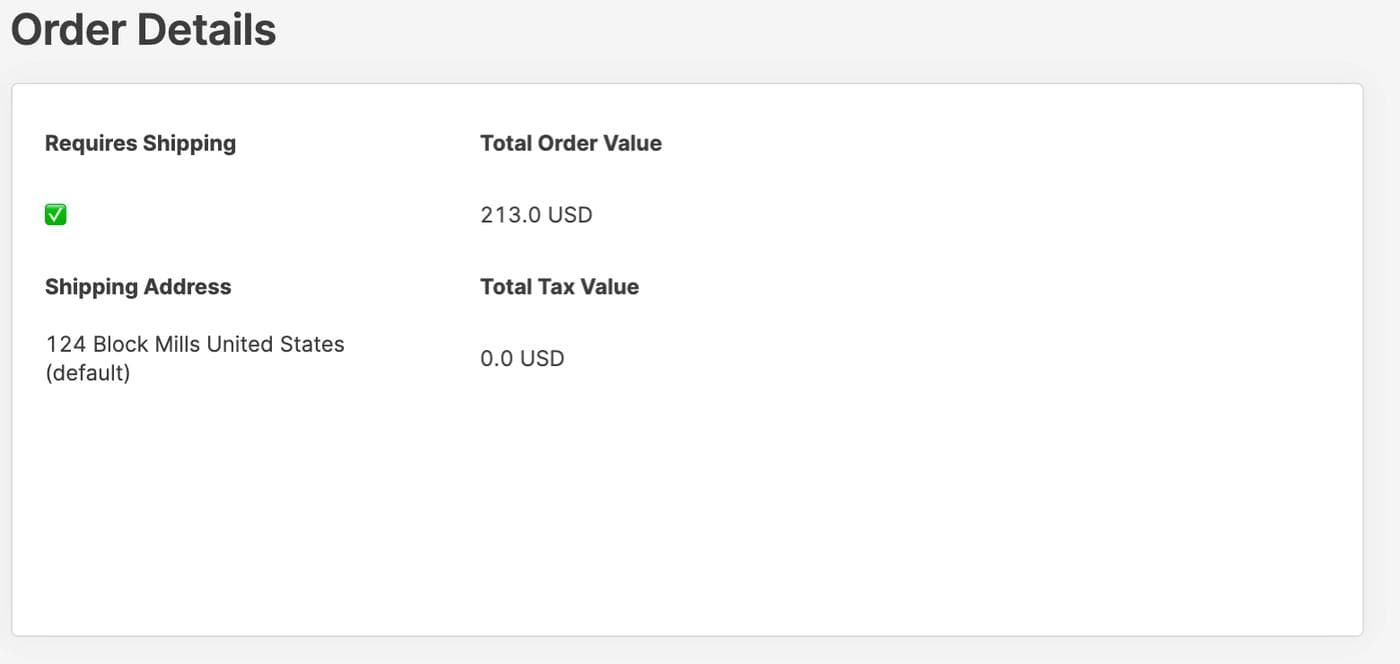
Here’s what the container should look like at this point:
To finish this up, let’s add in a small table to display which products are in the selected order. I’ll also include a text component on top that reads “Products.”
To make the table fit and look a bit better, we can remove a lot of stuff. Click on the products table and head over to the right sidebar. Toggle “Show download button” and “Show filter button” to off. Then replace the hard coded data in the “data” field with a reference to the currently selected row in the orders table, to the “line items” column:
{{ table2.selectedRow.data.lineItems.edges.map(d => d.node) }}
Let’s also turn on compact mode. Here’s what the final container should look like:
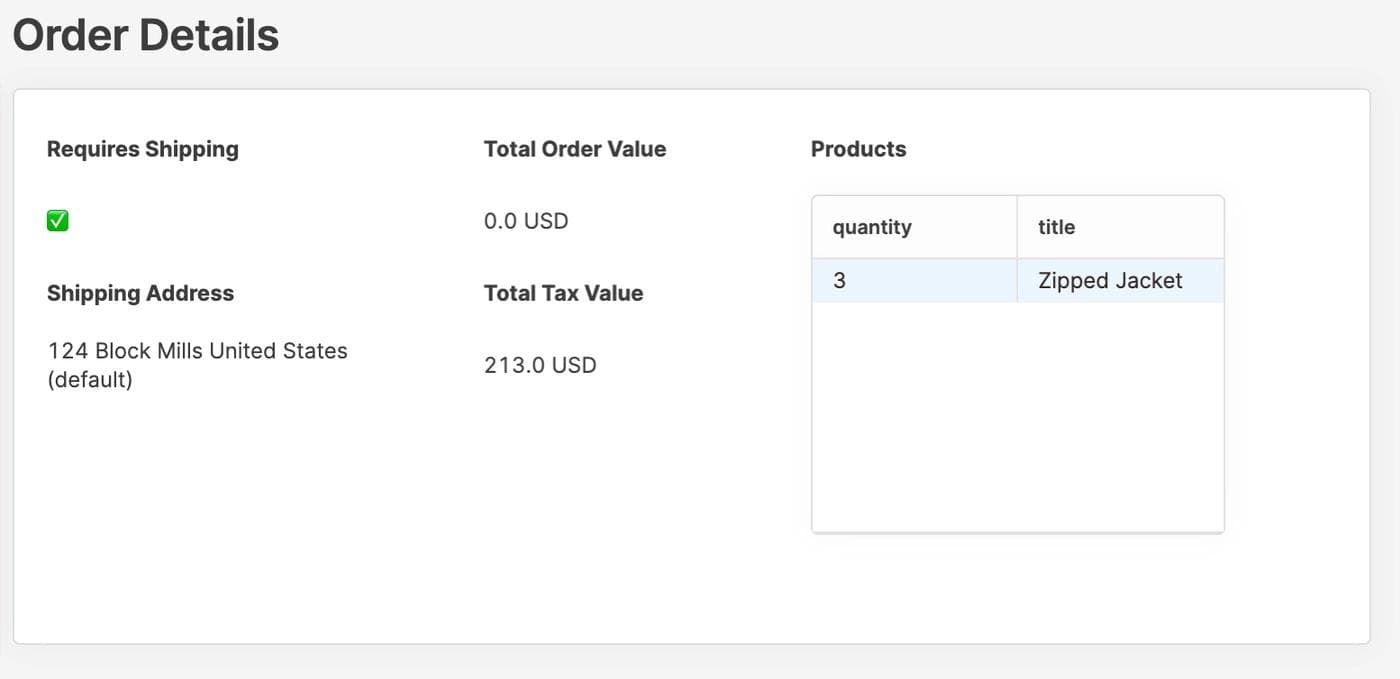
Try clicking on different rows in the orders table to see the container data update!
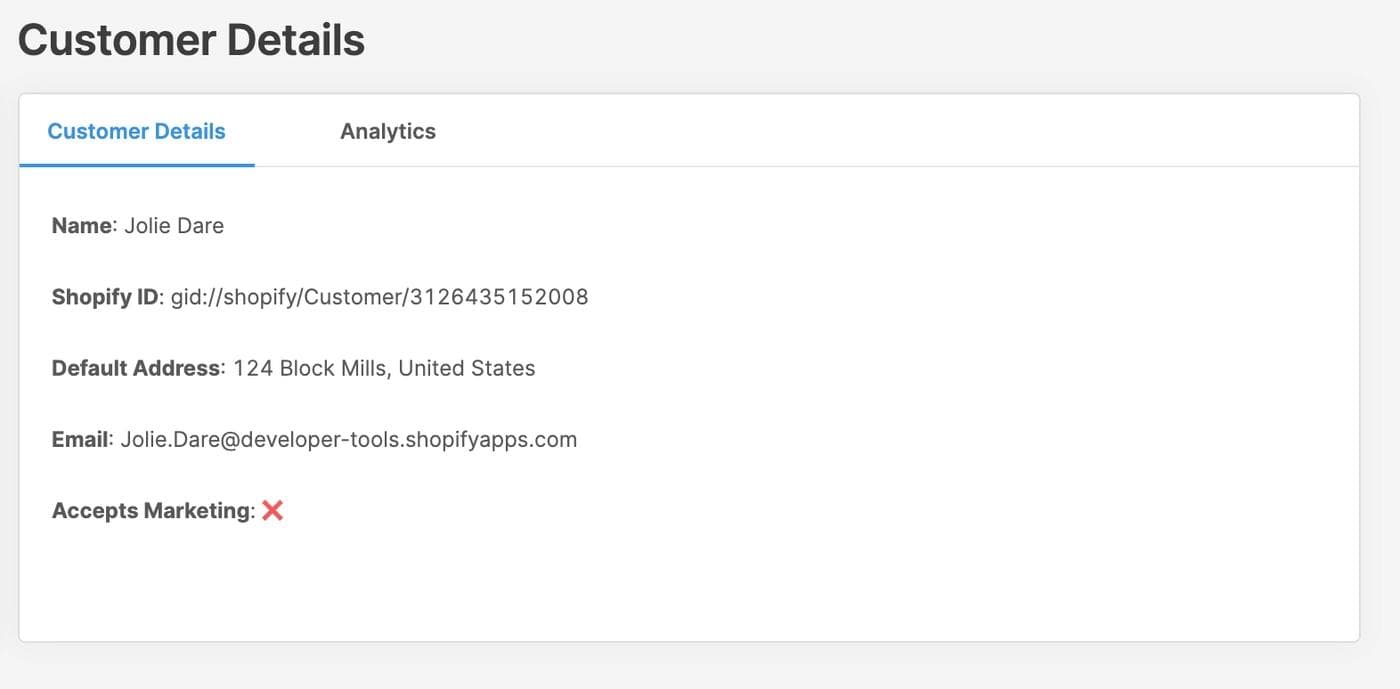
Now let’s add a details container for the customers table. Start by dragging a tabbed container up next to the customers table, and add a text component on top labeled “Customer Details.” This container is going to have two tabs: details about the customer, and some analytics about their orders.
We can label the two tabs in the tabbed container by clicking on it, heading over to the right sidebar, and changing the tab names. You can add as many as you want to the list too. I’m going to call the first one “Customer Details” and the second one “Analytics.”
Let’s start with the Customer Details tab. We’ll drag on 5 text components to show more detail about the selected row. Here’s what we’ll put in the “value” field for each:
**Name**: {{ table1.selectedRow.data.displayName }}**Shopify ID**: {{ table1.selectedRow.data.id }}**Default Address**: {{ table1.selectedRow.data.defaultAddress.address1 + ", " + table1.selectedRow.data.defaultAddress.country }}**Email**: {{ table1.selectedRow.data.email }}**Accepts Marketing**: {{ (table1.selectedRow.data.acceptsMarketing === true) ? "✅" : "❌" }}
You’ll have to resize a few of them based on your data, but here’s what my container looks like after adding these:
Last, let’s display the customer’s image alongside these details. Drag an image component into the container to the right of our text components. In the “Image URL” field for the image component (right sidebar), we’ll reference the customer’s image from the customer table:
{{ table1.selectedRow.data.image.originalSrc }}
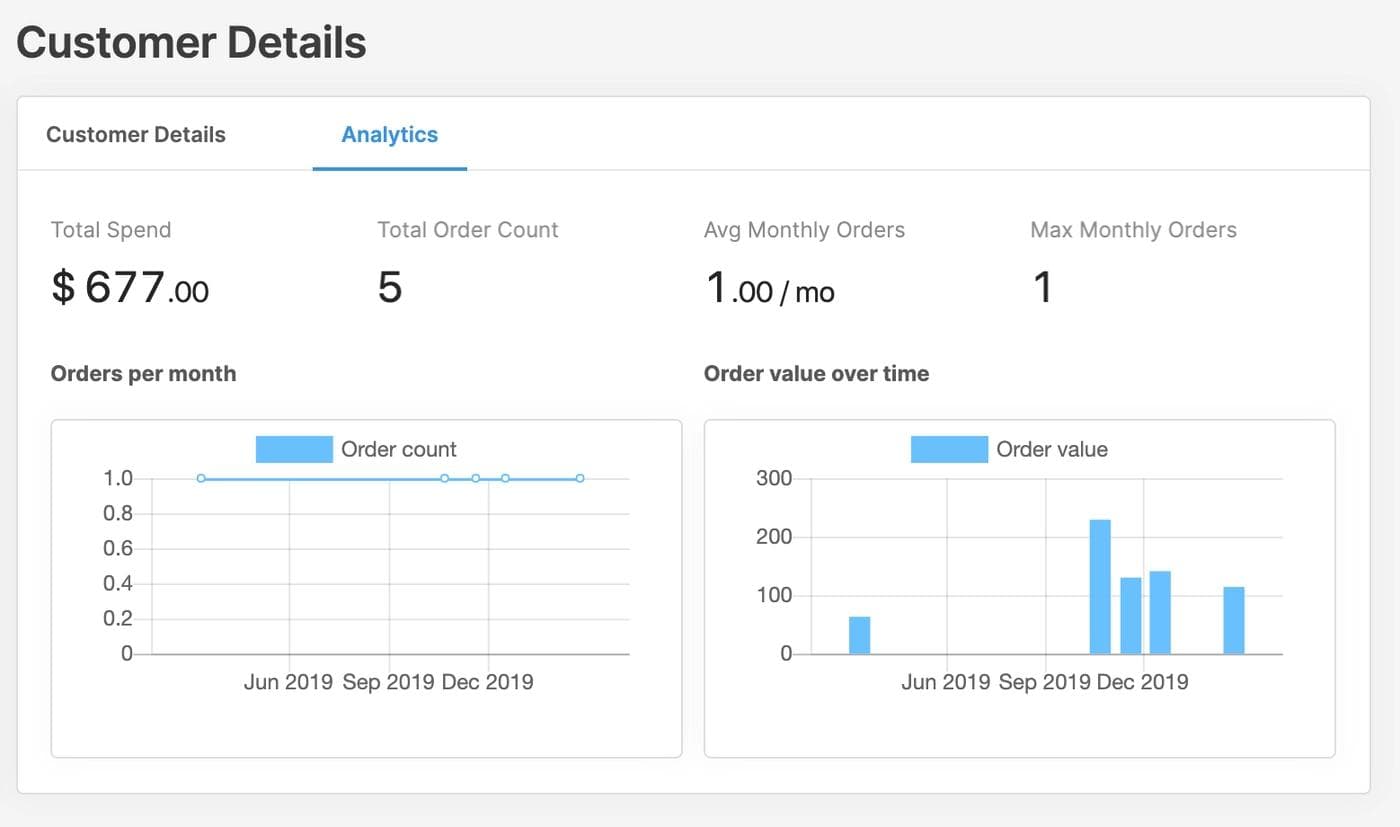
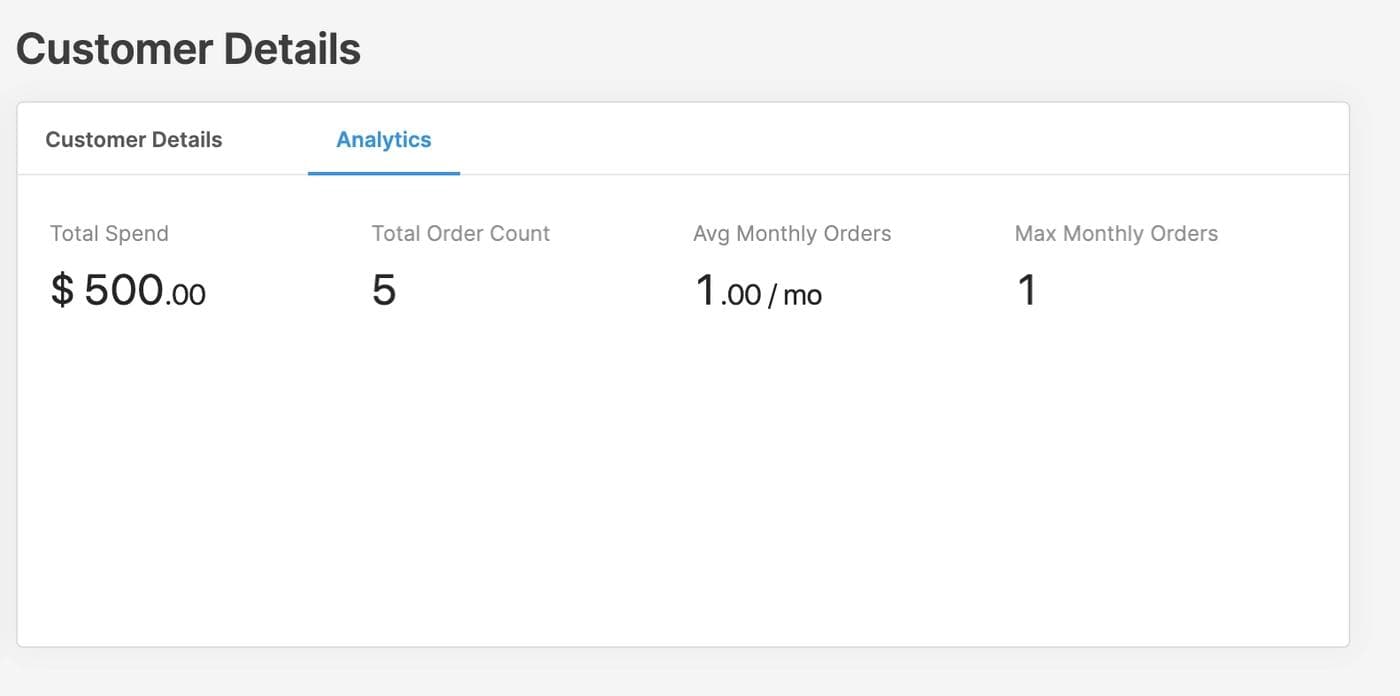
Nice! Finally, let’s head over to the second tab (“Analytics”). We’re going to be using three types of components: text, statistic, and line charts. Here’s what the finished tab is going to look like:
Let’s begin with the statistic components. We’re going to use 4 different ones: drag them on and then we’ll update their values.
- Total Spend
For the total spend statistic, we’ll need to sum up the customer’s order value across all of their orders. We can use Lodash’s _.sum function; try this Javascript snippet in the “Value” field of your statistic component:
{{ _.sum(table2.data.map(d => parseFloat(d.totalPriceSet.shopMoney.amount))) }}
This code is parsing each order’s totalPriceSet as a float and summing them all up for the selected row. We’re using table2 (the orders table), which contains all of the orders for the selected row in table1 (the customers table). Here’s are what the configuration should look like:
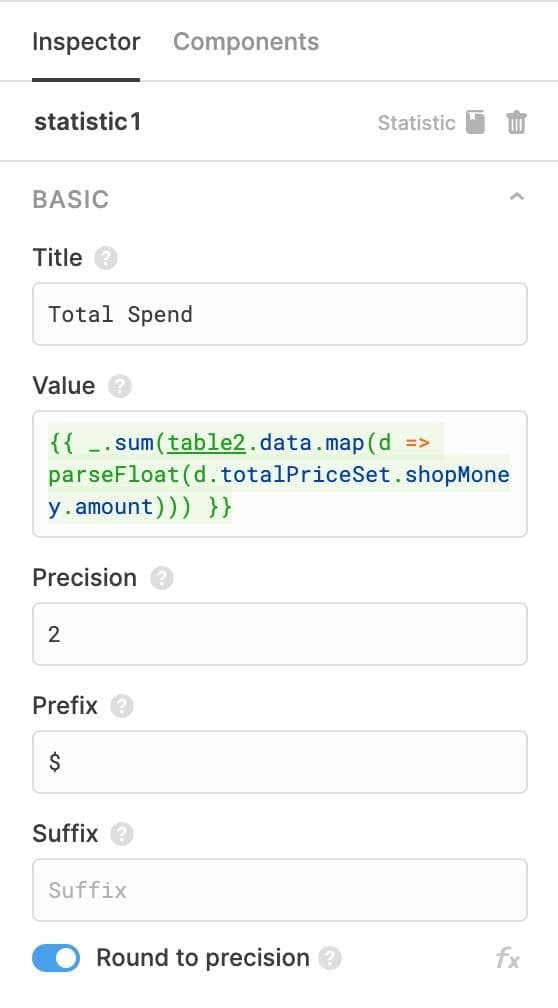
I’ve chosen $ as the prefix because all of our data is in USD, but you can change it to match yours.
- Total Order Count
This one’s easy – we can just take the number of rows in the orders table:
{{ table2.data.length }}
I also adjusted the precision to 0 (there are no half orders) and removed the prefixed dollar sign.
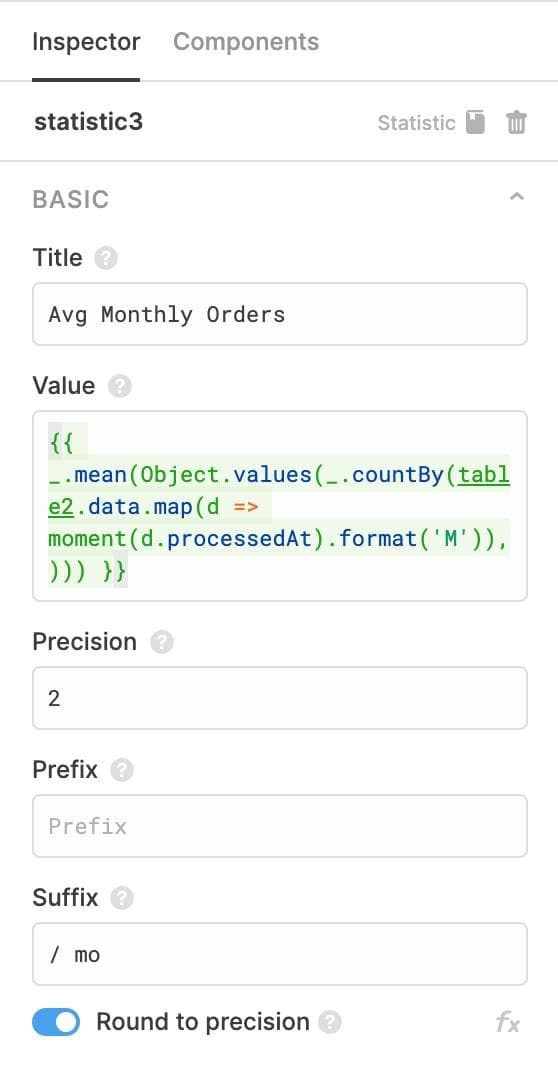
- Avg Monthly Orders
This one is a bit more complicated (I wish I was using Python!). We’re going to use Javascript to get the number of orders per month, and then take the average of all of those counts:
{{ _.mean(Object.values(_.countBy(table2.data.map(d => moment(d.processedAt).format('M')),))) }}
The Lodash _.countBy function takes an object and counts the number of records per key. Then we use the _.mean function to take the overall average.
- Max Monthly Orders
To find the max orders a customer has made in a month, we’ll just repurpose the code for average monthly orders, but change the _.mean to _.max.
{{ _.max(Object.values(_.countBy(table2.data.map(d => moment(d.processedAt).format('M')),))) }}
If all has gone well, here’s what your Analytics tab should look like thus far:
Next, let’s add some charts. We’ll create two: orders over time and order value over time.
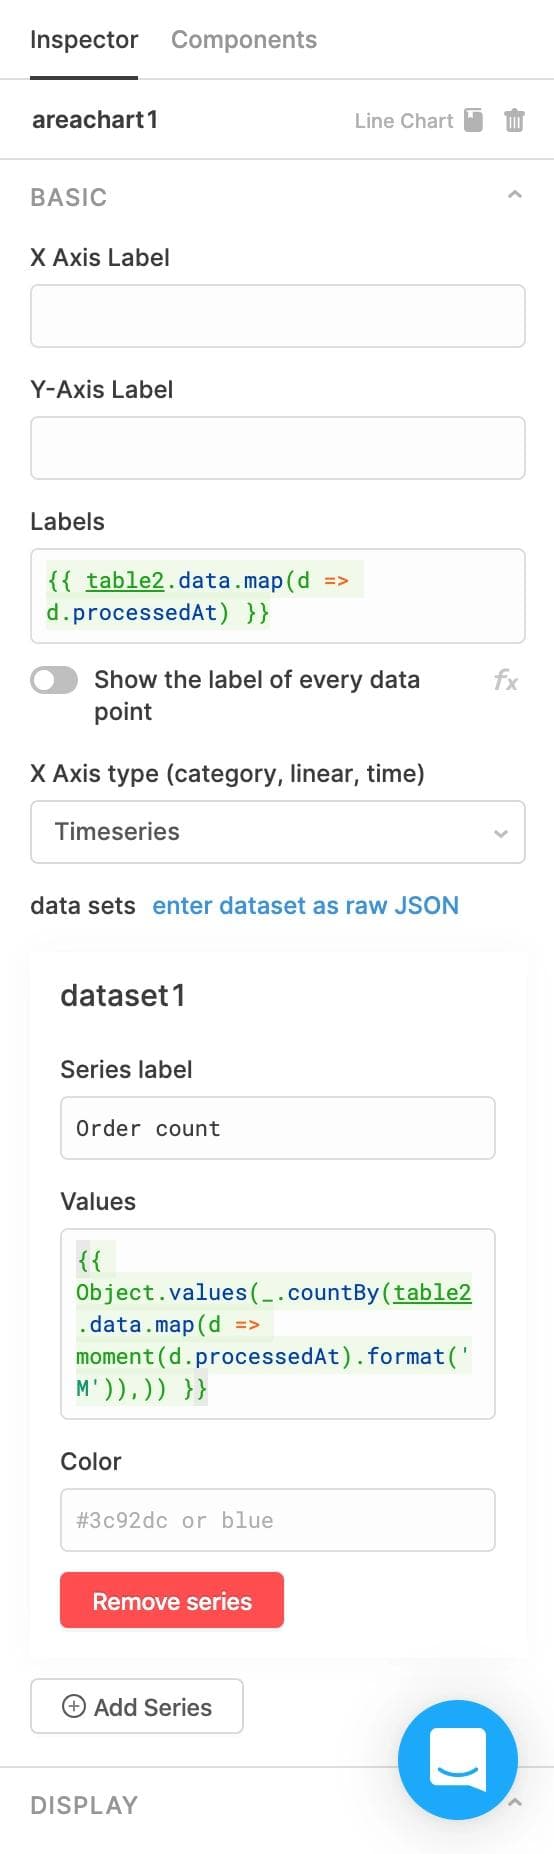
- Orders over time
Start by dragging a line chart component into our Analytics tab on the left side. There are two big fields we need to fill out: labels on the x axis, and values for the y axis. Click on the chart component and head over to the right sidebar. In the “Labels” field, we’ll add in some Javascript that retrieves all of the dates of the selected customer’s orders:
{{ table2.data.map(d => d.processedAt) }}
Scroll down a bit in the right sidebar, and you’ll see a section for dataset1. In the “Values” field, we’ll add in a reference to the number of orders per month. This is the exact same JS as we used above for the monthly orders statistic:
{{ Object.values(_.countBy(table2.data.map(d => moment(d.processedAt).format('M')),)) }}
Here’s what the final configuration should look like for this line chart:
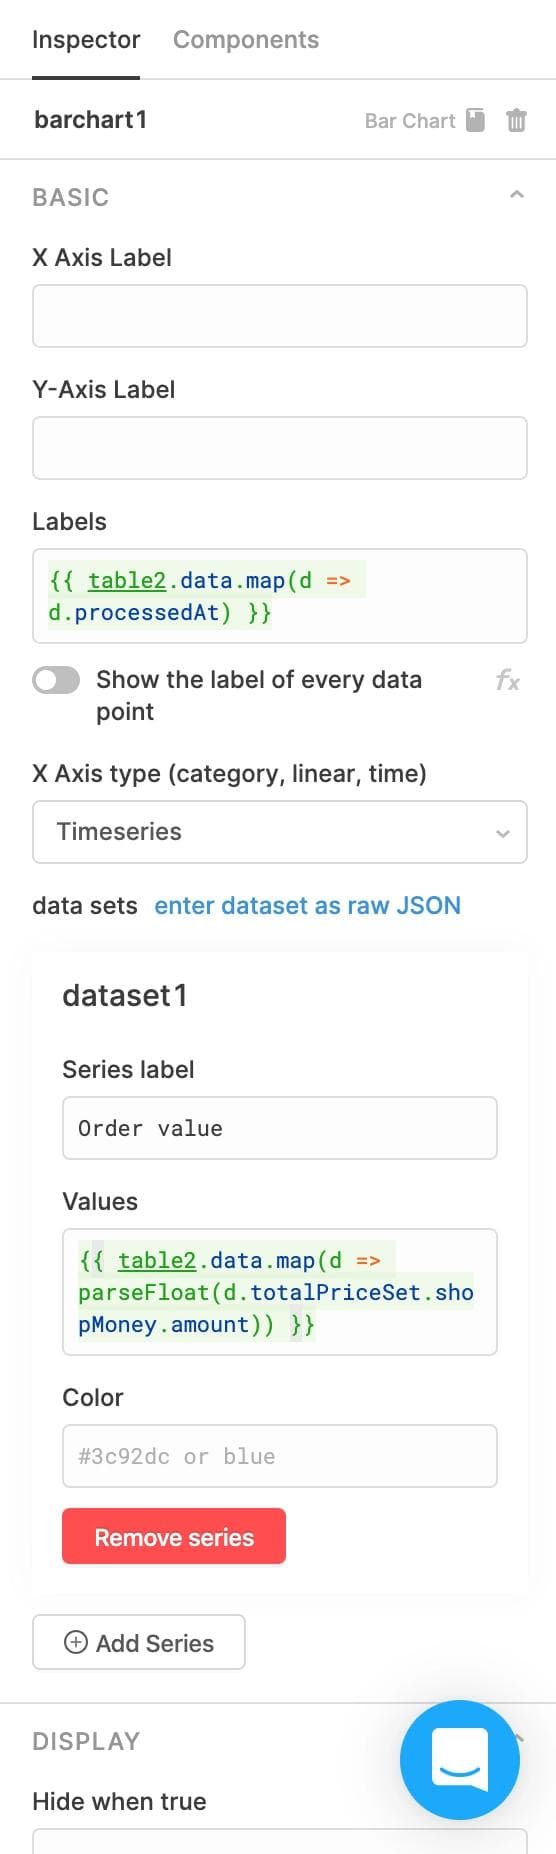
- Value over time
Drag a bar chart component onto the remaining open section of the Analytics tab. In the “Labels” field, we’ll put the same values as the first chart:
{{ table2.data.map(d => d.processedAt) }}
For the “Values” field in dataset1, we’ll put the order amount for each order:
{{ table2.data.map(d => parseFloat(d.totalPriceSet.shopMoney.amount)) }}
Here’s the final config:
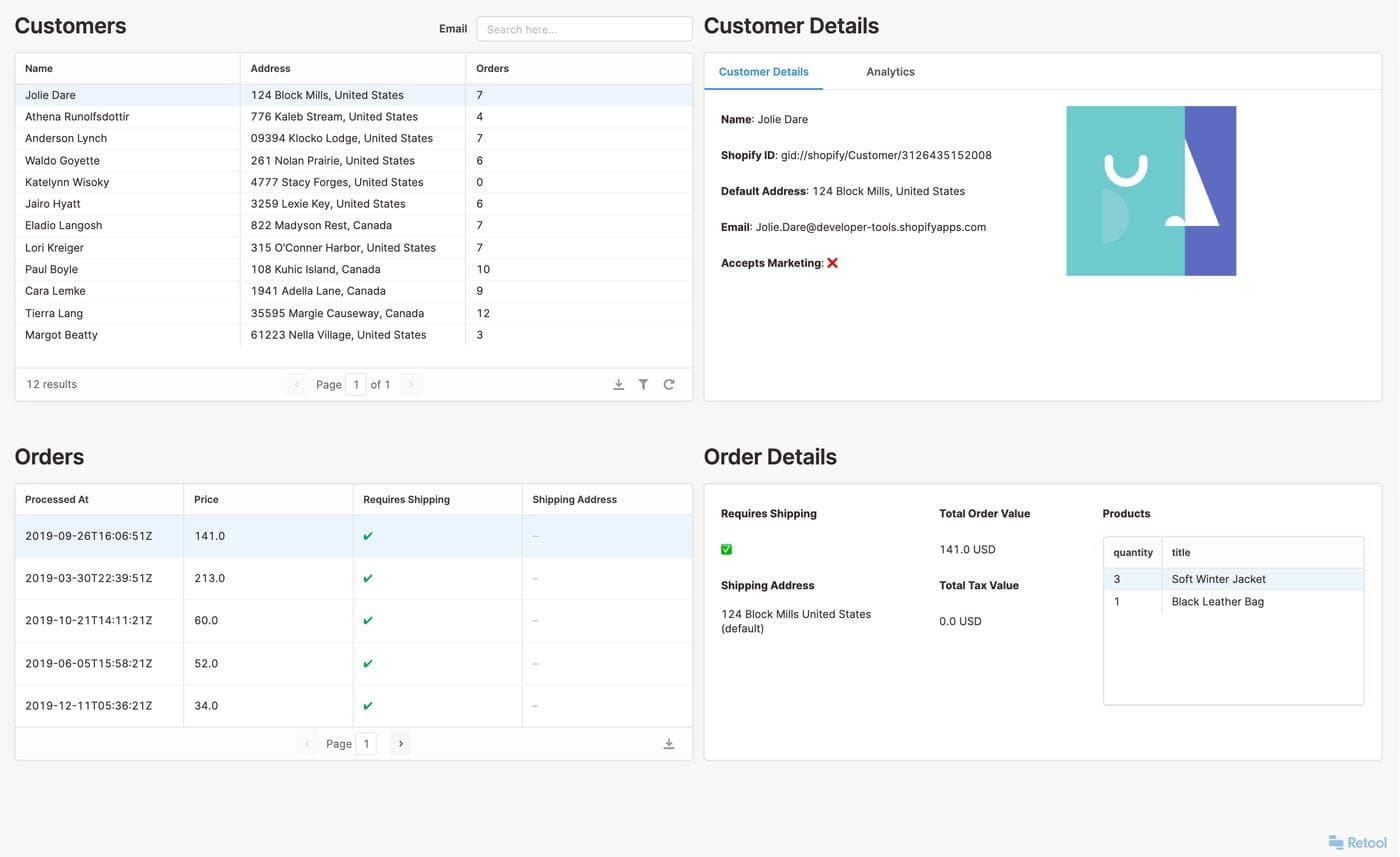
Triple check that everything works by clicking around, and you should be done! This is what our finished app looks like:
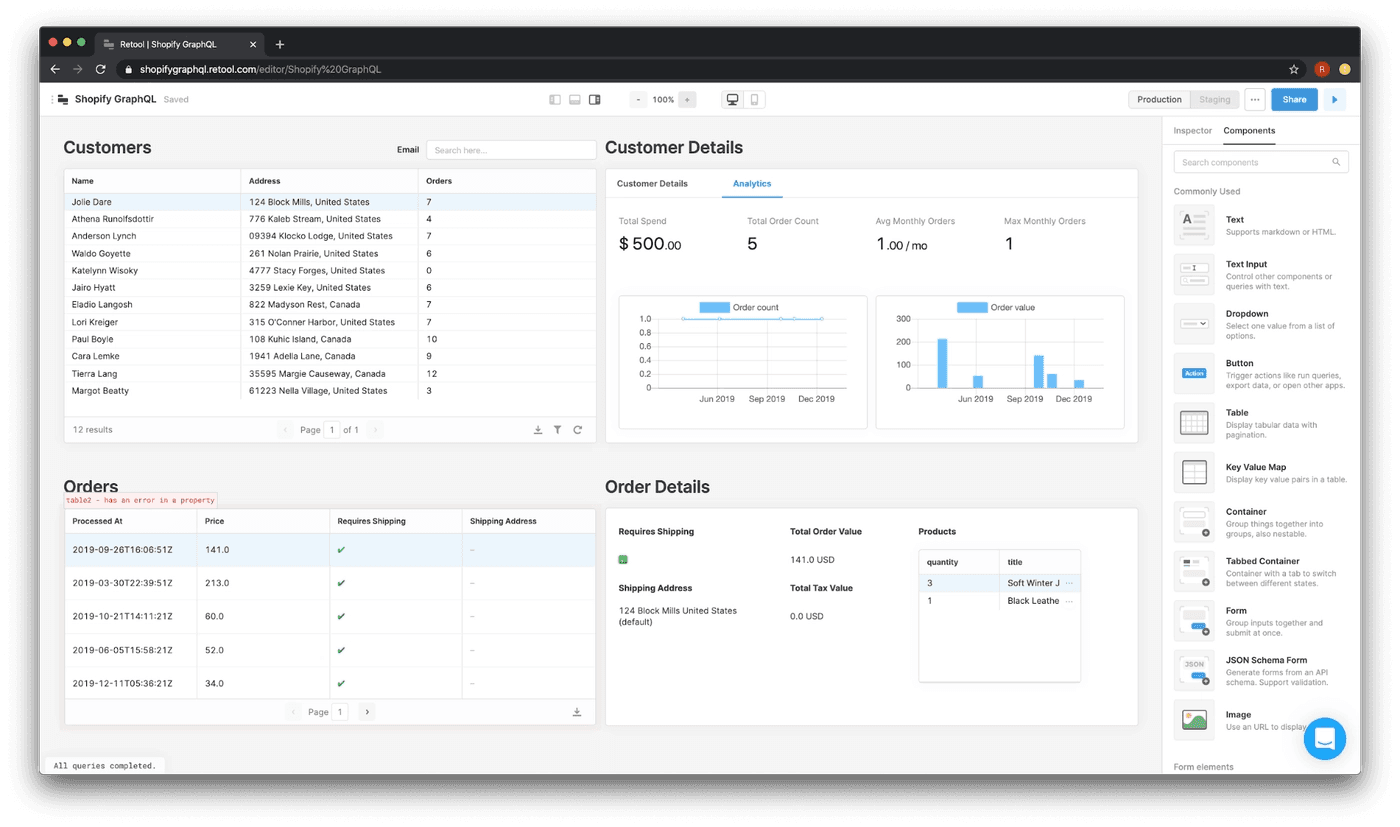
Congrats: you’ve built a functional app that reads from a GraphQL API in under an hour (can you imagine how long this would take from scratch?). If you run into any problems, always feel free to reach out to us through Intercom (the little chat icon on the bottom right).
Reader