
SQL. The last domain of caps lock.
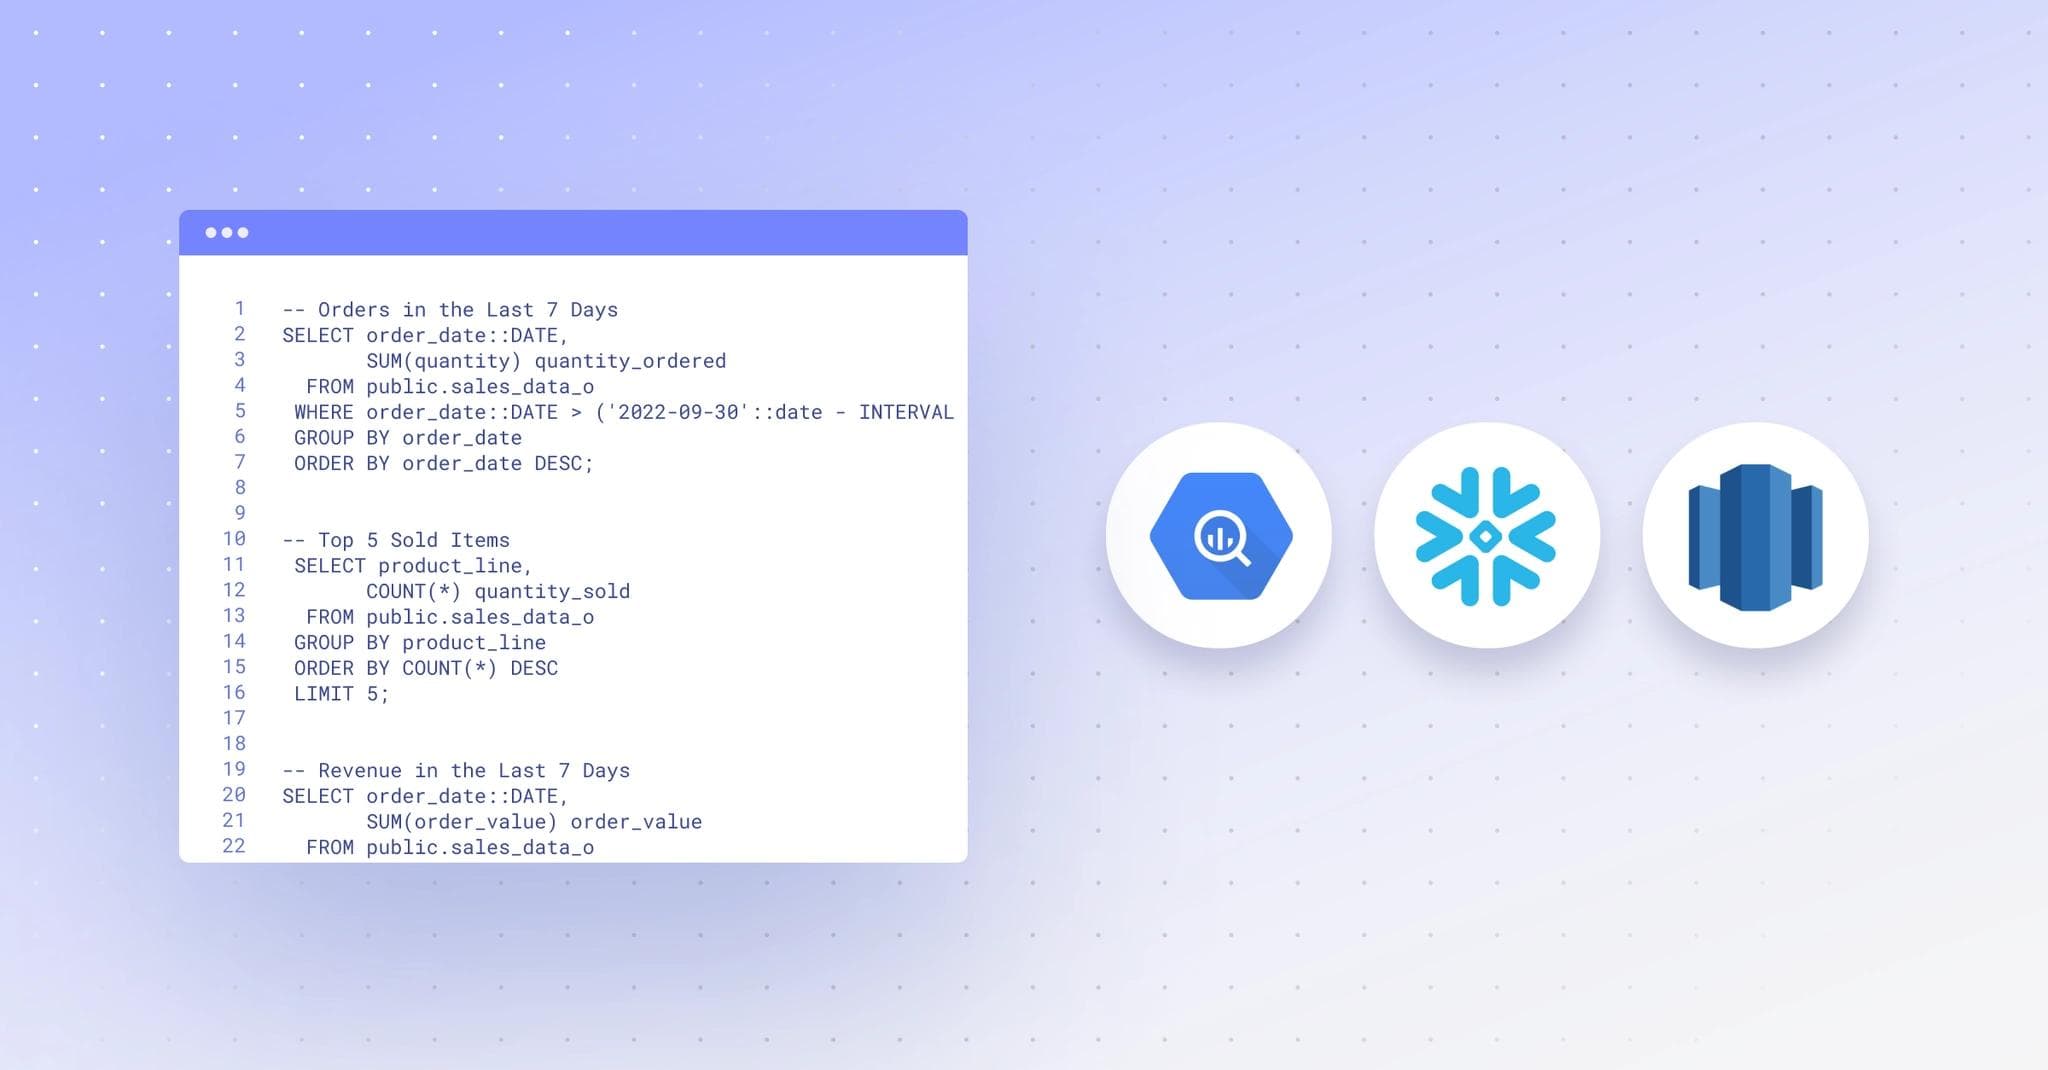
Whether you’re an S-Q-L or sequel person, you know it’s one of the most potent languages at your disposal. SQL, or Structured Query Language, allows developers to query, manipulate, and manage relational databases. It enables them to extract valuable insights from vast amounts of structured data and build robust data-driven applications.
SQL is a domain-specific language, designed specifically for interacting with databases. While incredibly powerful, SQL can be intimidating for non-technical or external users who need to access and analyze data.
With this post, you'll learn how to use Retool create an intuitive graphical user interface (GUI) that allows users to interact with databases using SQL without writing custom apps.
First, we need to get the data from our database into Retool before we can query it. Head to Resource in your Retool dashboard:

There are a ton of different SQL databases, and Retool supports most of them. The primary two flavors are Postgres and MySQL. We’re going to be using a Postgres database:

We could use a Retool database, but because it's already so well-integrated into Retool, we’d be bypassing part of the setup process. Retool databases work out-of-the-box. If you want to use a Retool database, you can follow the Retool Database Quickstart to set it up, and then skip ahead to the SQL part—those steps will be the same.
Getting back to our process here—you must add the Postgres connection information for your database. You can do this manually, or add the connection string under “Autofill using” and Retool will infer each field.

You can see from the schema that the connection worked when you connected. Here, we’re connecting a database with customer information:

We’re now ready to start using an SQL database with Retool.
Before we start putting together some SQL queries, we want to think about how our UI will look. Let’s head back to “Apps” and then create a new web app:

On the new page, click the “Add UI” button to show the components you can add to your application. Here, we'll build a GUI that allows us to see a list of customers, search that list, see more information about a selected customer, and see some aggregate data from our customers. To do that, we’ll need:
- A container to frame our dashboard
- A text input that we’ll use for search
- A table to show all our customers
- A component to show information from a single customer
- A graph to chart some data
With all that in place, but before we’ve loaded our own data, it looks like this:

Retool prepopulates some mock data for us to understand the layout. With the GUI ready, we can move on to the SQL queries.
In the GUI we just created, you’ll notice the table and chart have options to “Connect data.” Let’s do that for the table. Click “Connect data” to see a new frame for adding our resource. Search the “Resource” field for the database name we previously added. Here, it is called “customers.” Here, you can create a unique name for your query since we’ll create a few. We’ll name this one get_all_customers.
We can now write our SQL. The first query we’ll write will be simple: it will get a list of all customers in our Postgres database.
1SELECT * FROM customers
This means, “Give me every row and column from the customers table.”

If we select “save and run,” we can see the data populated in our table component:

Formatting and design are automatically added to each row in the table (no design expertise necessary).
You can build any complex SQL GUI with those basic steps. The queries and components might be more complicated, but the process will be the same: create a component, connect data, write a query, and the data will appear. Now, we’re going to add a few other helpful components to the SQL GUI.
Adding charts to a GUI is a great way to quickly show numerical data that might be difficult to understand in tabs and rows. This example separates revenue by customer support rating.
We will reuse the get_all_customers query and just use some of the data from the dataset. Click on the chart and look in the inspector:

As you can see, the data source is the get_all_customers query. We’ll then set this up as a bar chart, with the customer support rating from the query as the X-axis. Retool will automatically graph a few of the return datasets. Here, we’ll just want one: the sum of the monthly revenue.
Next, we’ll create an individual customer component. We just added the component frame above, so we’ll add a few fields for the customer name, support rating, subscription plan, and monthly revenue.
We’re going to need a new query for this, which we’ll call get_single_customer:
1SELECT * FROM customers WHERE customer_id = {{ table1.selectedRow.customer_id }}
Whenever you click on a row in the table, Retool returns the data for that entry in a selectedRow object. So, as you click through rows, you can get the customer ID for the selected customer. We’re feeding that number into a SQL query using the double curly brackets {{ }}. This means that if we selected the first row, this query would read:
1SELECT * FROM customers WHERE customer_id = 1
So, the database would return only the customer information for the first customer. We can then use that data in our individual customer component. If we want the customer’s name, for instance, we’d use:
1{{get_single_customer.rawData.company_name[0]}}
We can put this in the “Value” field of a text field to show the customer name:

Doing the same for the other fields, we get a nice little breakdown of each customer’s details when we select them in the table:

If you noticed that we have to scroll through and manually find any entry, don’t worry—we can build a search tool in the GUI to easily find a specific customer. To do that, we’re going to change the query attached to our table for a new query that we’ll call get_customer_by_name:
1SELECT * FROM customers WHERE company_name LIKE {{ searchbar.value }}
We’re taking the value from our search text input and adding it to our SQL query, again using curly bracket nomenclature. This will search our database for any entry with a customer name like what we type into the search field:

We’ve now built a SQL GUI using Retool and created three queries. You could stop here, or you could keep going and build more complex components. In Retool, you can:
- Implement filtering and sorting options for the customer table, allowing users to filter by specific criteria (e.g., industry, subscription plan) and sort the results based on columns (e.g., monthly revenue, customer since date)
- Include a form to add new customers or update existing customer information directly from the GUI. This would involve creating INSERT and UPDATE SQL statements based on user input
- Handle large datasets efficiently by adding pagination to the customer table. This can be done using SQL's LIMIT and OFFSET clauses in combination with Retool's pagination component
- Filter table components using AI to converting user questions into correct SQL queries for a given dataset.
Creating a SQL GUI in Retool is based on a simple process—create a component, connect it to data, and write queries to manipulate the exact data you need.
Want to build your own custom SQL GUI today? Sign up for a free Retool account and give it a whirl.