

Analyzing and visualizing data is a crucial part of any business or organization, but it can be tedious and time-consuming. As someone who likes finding ways to save time and effort, I’m game to explore anything that can make this kind of work faster and easier. That’s where Retool Workflows come in.
Retool Workflows make it easy for developers to create automated processes that send custom alerts, and analyze and visualize data using a graphical interface—and to run those processes on a schedule.
With Python support added to Retool Workflows, I wanted to play around and do some fun data analysis with it. I thought about some datasets to use—IMDb movie ratings, global coffee production statistics, UFO sightings... But I kept coming back to something that I love even as an adult—something that felt a little poetic, given the parallels I recognized with Retool: LEGO!
Just like how LEGO pieces of different shapes and sizes connect to build pretty much anything you can dream up, Retool Workflows provide a way to drag and drop blocks of code, customize them, and connect them to create a seamless automation for data analysis. Building with Retool Workflows is, I realized, like building a LEGO model, but instead of using plastic bricks, you’re using Python/JavaScript code blocks. Instead of creating a castle or a spaceship, you can build a data analysis workflow that streamlines your ETL and reporting tasks.
So, with LEGO as inspiration, allow me to demonstrate how Retool Workflows can be used to analyze data and create stunning visualizations using Python libraries like pandas, seaborn, and matplotlib.
We’ll use this dataset available on Kaggle.com to analyze and visualize the following:
- Number of LEGO sets released over the years: We’ll dive into the data to see how many LEGO sets were produced each year and track how that number has evolved over time, allowing us to gain insights into the growth of the LEGO world.
- Average number of pieces per LEGO set over the years: How many pieces does the average LEGO set contain? We’ll crunch the numbers to find out, and explore how this has changed over time as sets have become more complex and detailed.
You can download the JSON for these workflows here: Workflow 1: Number of sets produced over the years, and Workflow 2: Average number of pieces per LEGO set over the years), and import it into your Retool account.
Ready? Let’s get building.
Here’s the basic outline that we'll be following to build the workflows for each of these analyses:
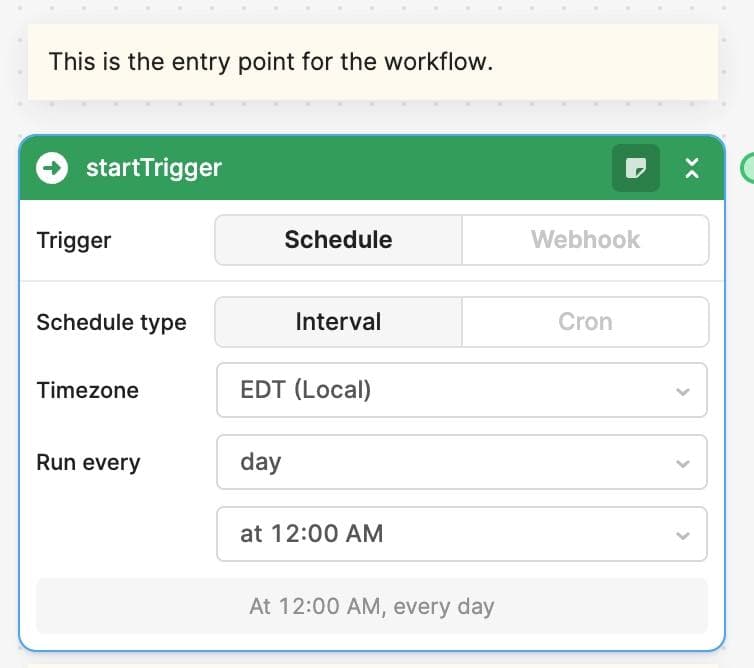
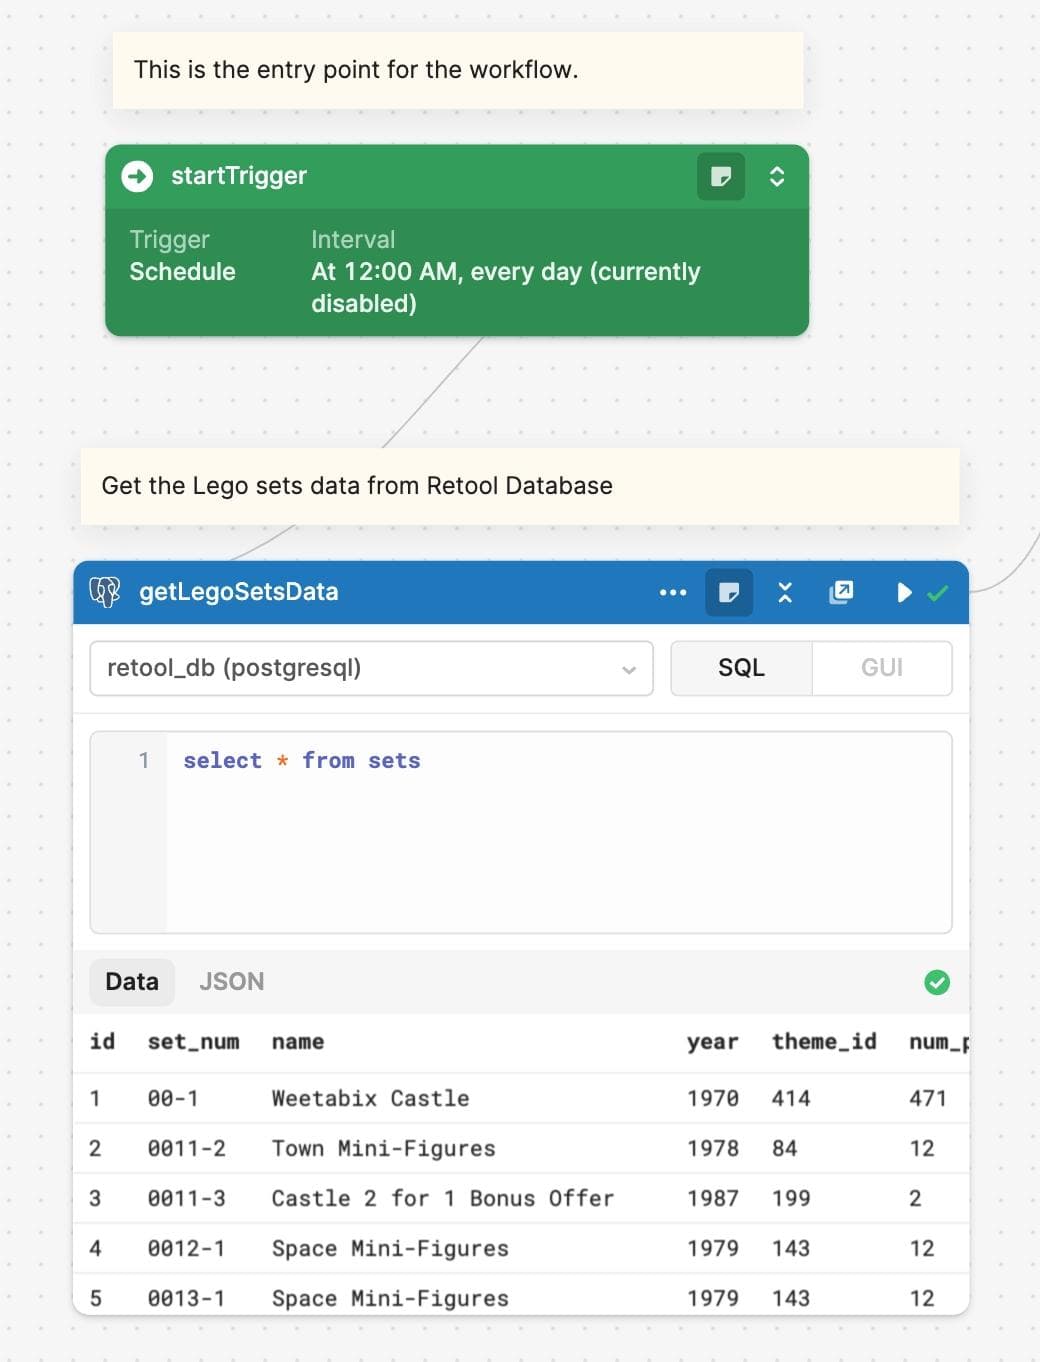
- Workflow Start Trigger: This block will be the starting point of our Retool workflow. We can configure this block to trigger our workflow at regular intervals using Schedule/Cron or Webhook.
- Fetch your data (getLEGOSetsData): This block will use SQL to query Retool Database for the LEGO set data we want to analyze.
- Customize with code (LEGOSetsPerYear): This is where the magic happens! We’ll use Python libraries like
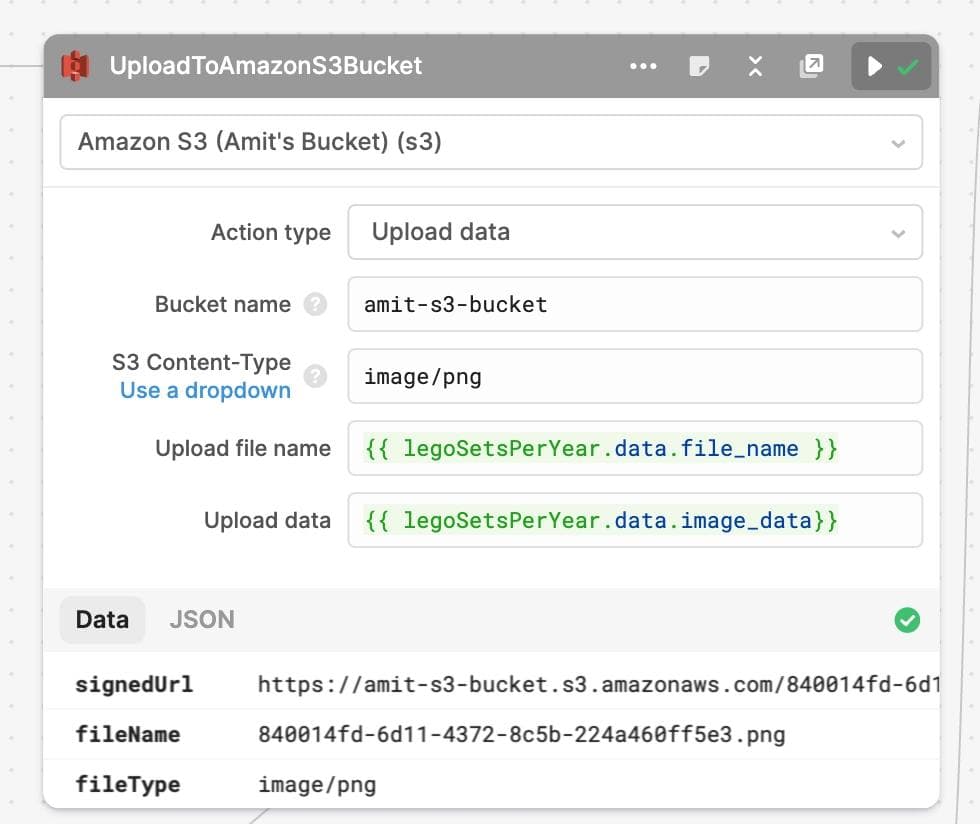
pandas,seaborn, andmatplotlibto analyze the data and create visualizations. For example, we can usepandasto group our data by year and then useseabornto create a bar chart showing the number of sets produced each year. - Fire an action (UploadToAmazonS3Bucket and getS3URL): Once we have our visualizations, we can save them to a file buffer and then use Retool’s native integration for Amazon S3 to upload the files to our S3 bucket. This will allow us to easily share the images with others or include them in reports.
- SendEmail: Finally, we’ll use Retool’s native integration for SendGrid to send the visualizations in an email. This is a great way to share our analysis with others or to receive automated reports.
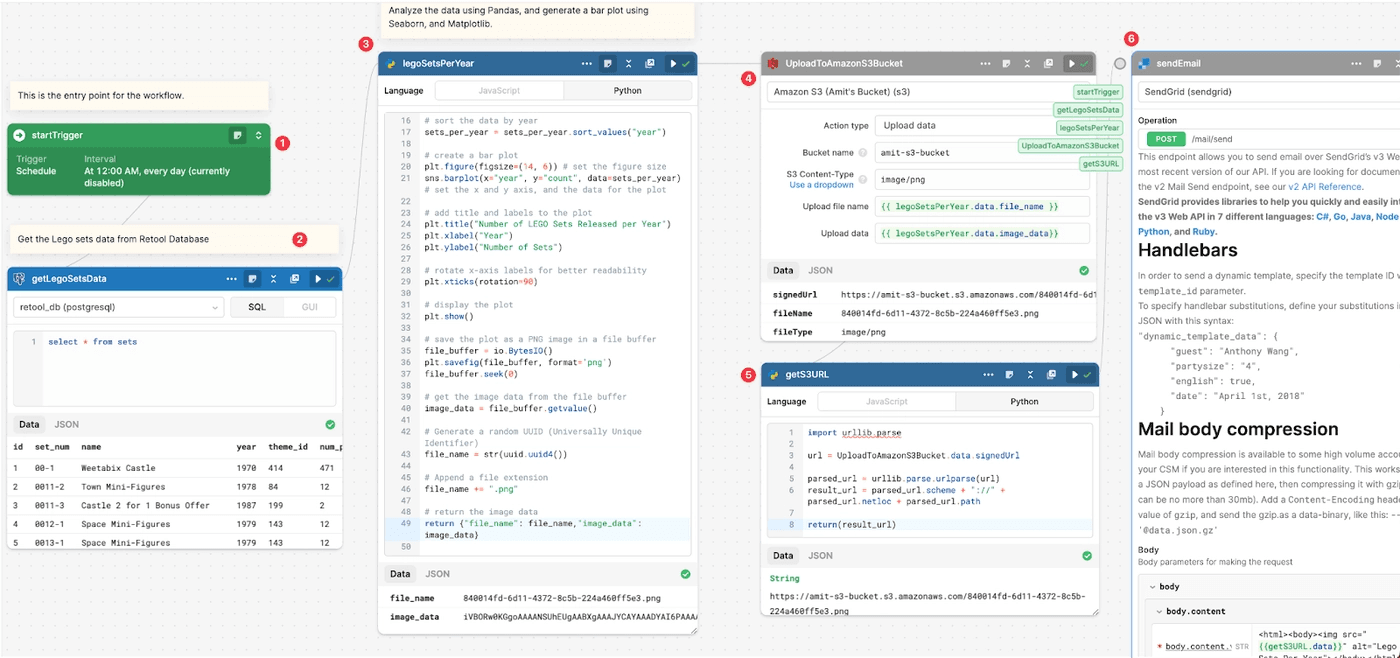
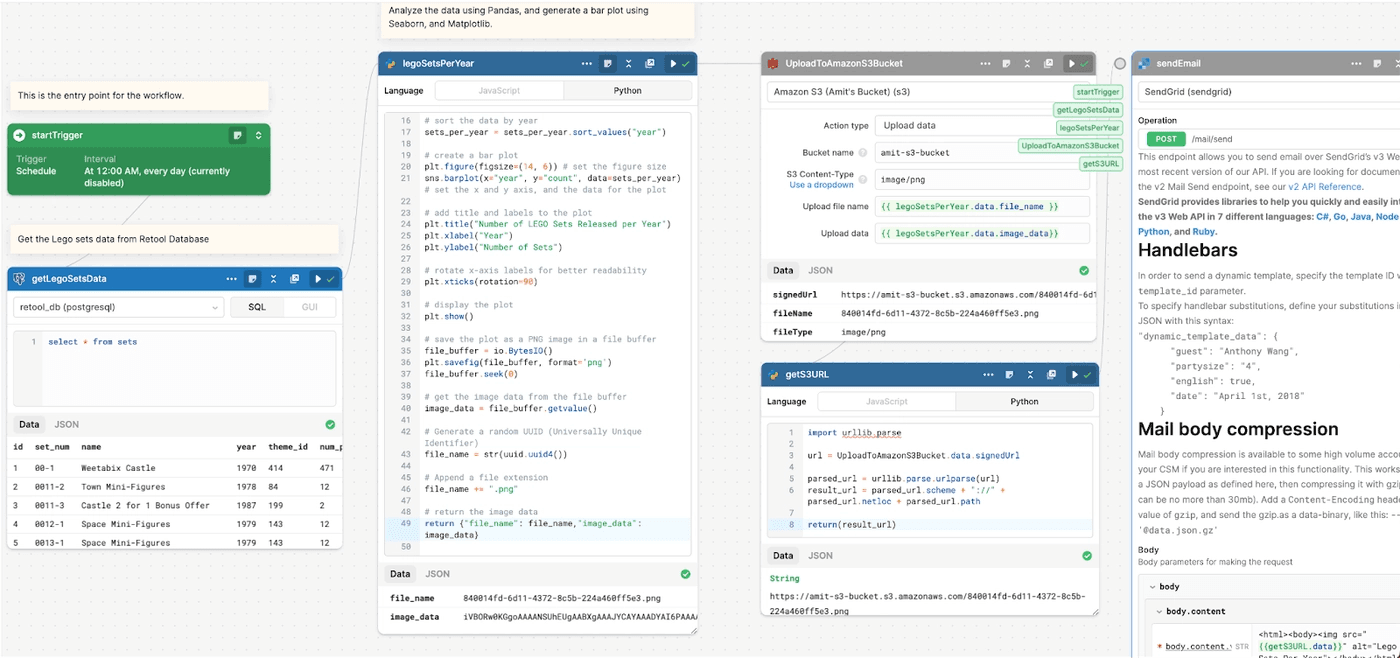
Here’s what the final workflow will look like:
The StartTrigger block is the entry point for the workflow. You can select this to either be a Schedule/Cron job or a Webhook. We’ll just let it be at its default value, but feel free to play around with it if you like.
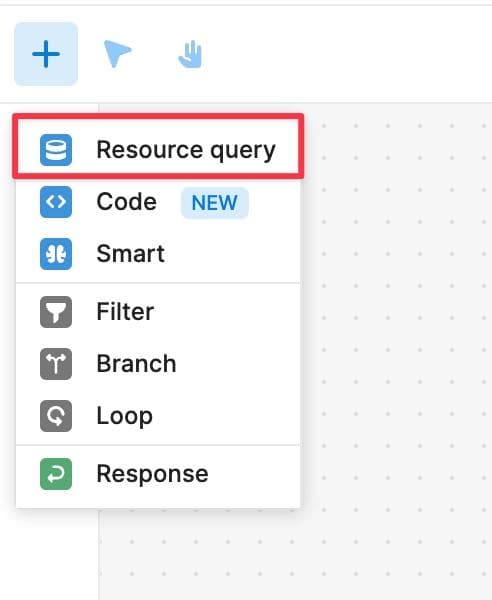
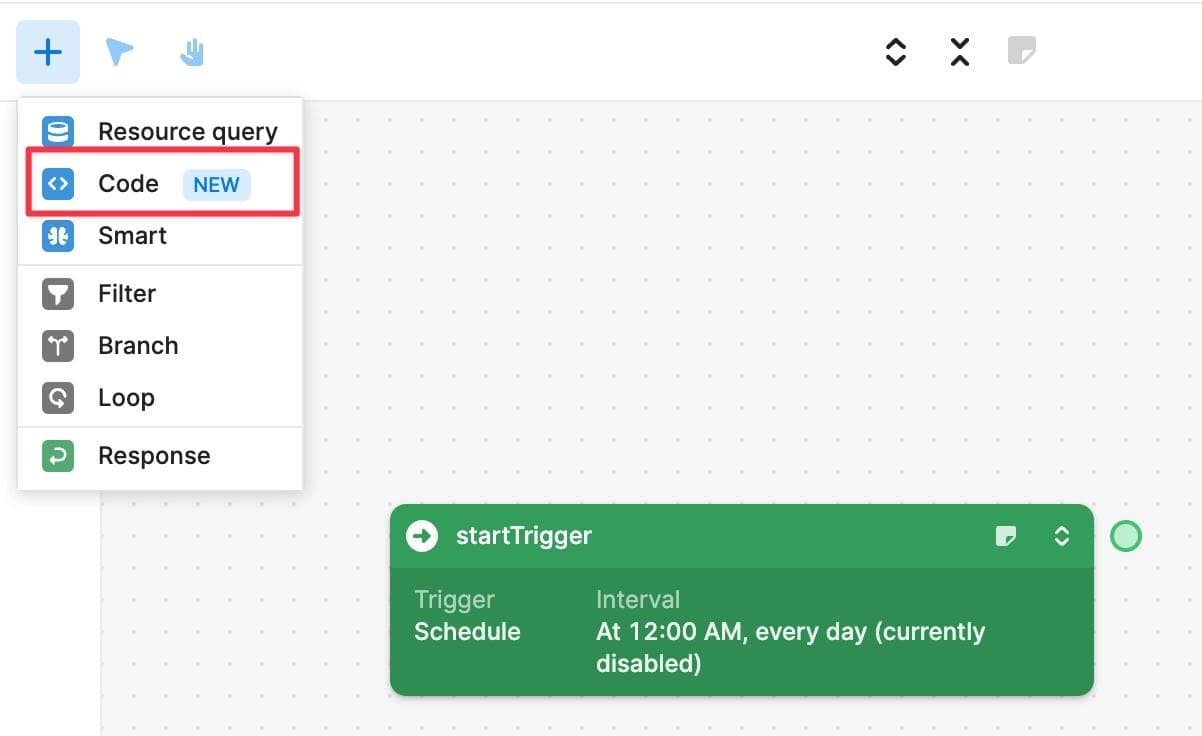
Click on the “+” button on the left side bar, and then click on “Resource Query”. Then click on the canvas to place it next to the StartTrigger block.
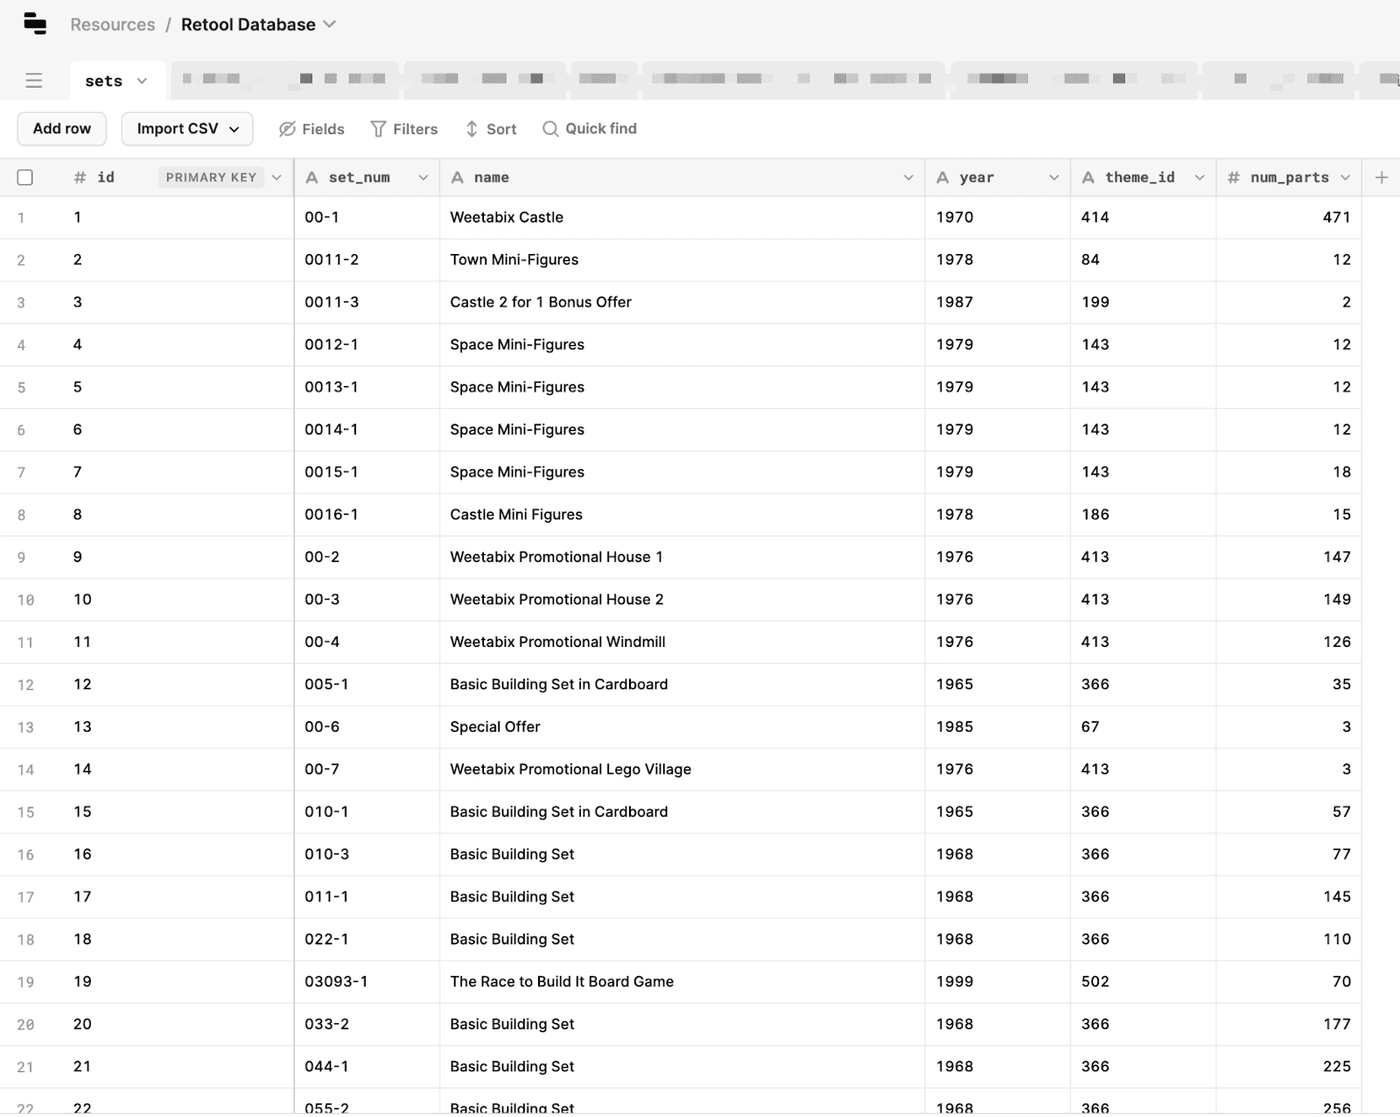
Inside the Resource Query block, choose the source for your database. This could be any of the data integrations supported by Retool, including any REST/GraphQL API, or databases like PostgreSQL, DynamoDB, or MongoDB. In this case, I downloaded this LEGO dataset available on Kaggle.com in CSV format, and imported it data into Retool’s built-in database using the CSV import feature.
So, we’ll choose retool_db (postgresql) as the resource, and then type the SQL query to retrieve the LEGO data set from Retool Database.
You can run each block individually to see the results of that block, like we did to run the SQL query.
Now that we have our LEGO data available in our workflow, we’re ready to write some Python code to analyze this data.
We’ll add a “Code” block to our workflow, and write some Python code to analyze the data using the Python libraries mentioned earlier.
1 2 3 4 5 6 7 8 9 10 11 12 13 14 15 16 17 18 19 20 21 22 23 24 25 26 27 28 29 30 31 32 33 34 35 36 37 38 39 40 41 42 43 44 45 46 47 48 49import pandas as pd import seaborn as sns import matplotlib.pyplot as plt import io import uuid # create a pandas dataframe called lego_sets using the lego set data retrieved in the previous block lego_sets = pd.DataFrame(getLegoSetsData.data) # count the number of sets released per year and store it in a new dataframe called sets_per_year sets_per_year = lego_sets["year"].value_counts().reset_index() # set the column names of the sets_per_year dataframe sets_per_year.columns = ["year", "count"] # sort the data by year sets_per_year = sets_per_year.sort_values("year") # create a bar plot plt.figure(figsize=(14, 6)) # set the figure size sns.barplot(x="year", y="count", data=sets_per_year) # set the x and y axis, and the data for the plot # add title and labels to the plot plt.title("Number of LEGO Sets Released per Year") plt.xlabel("Year") plt.ylabel("Number of Sets") # rotate x-axis labels for better readability plt.xticks(rotation=90) # display the plot plt.show() # save the plot as a PNG image in a file buffer file_buffer = io.BytesIO() plt.savefig(file_buffer, format='png') file_buffer.seek(0) # get the image data from the file buffer image_data = file_buffer.getvalue() # Generate a random UUID (Universally Unique Identifier) file_name = str(uuid.uuid4()) # Append a file extension file_name += ".png" # return the image data return {"file_name": file_name,"image_data": image_data}
To get started, I’ve imported three handy libraries: pandas, seaborn, and matplotlib.
pandas is a library that helps us work with tables of data. It’s useful when we have a lot of data to work with or when we need to combine different types of data (like numbers and text), like we do with our LEGO dataset.
seaborn helps us make pretty graphs and charts from data. We can use it to visualize data in different ways to better understand patterns and relationships.
matplotlib helps us make all kinds of graphs and charts. It’s very versatile, in the sense that we can use it to make simple or complex visualizations. We can use it to make things like line graphs, scatter plots, and bar charts. We’ll use a combination of seaborn and matplotlib to generate this graph to find out the number of sets released over the years.
We also use the library io which is a part of Python and helps you work with input and output, like reading and writing files, strings, or byte arrays. We use this to create a file buffer object that stores the image data generated by our plotting libraries in memory as bytes.
We then get the image data from the file buffer object for further use—in this case, we’re storing it in an S3 bucket and using that to send an email.
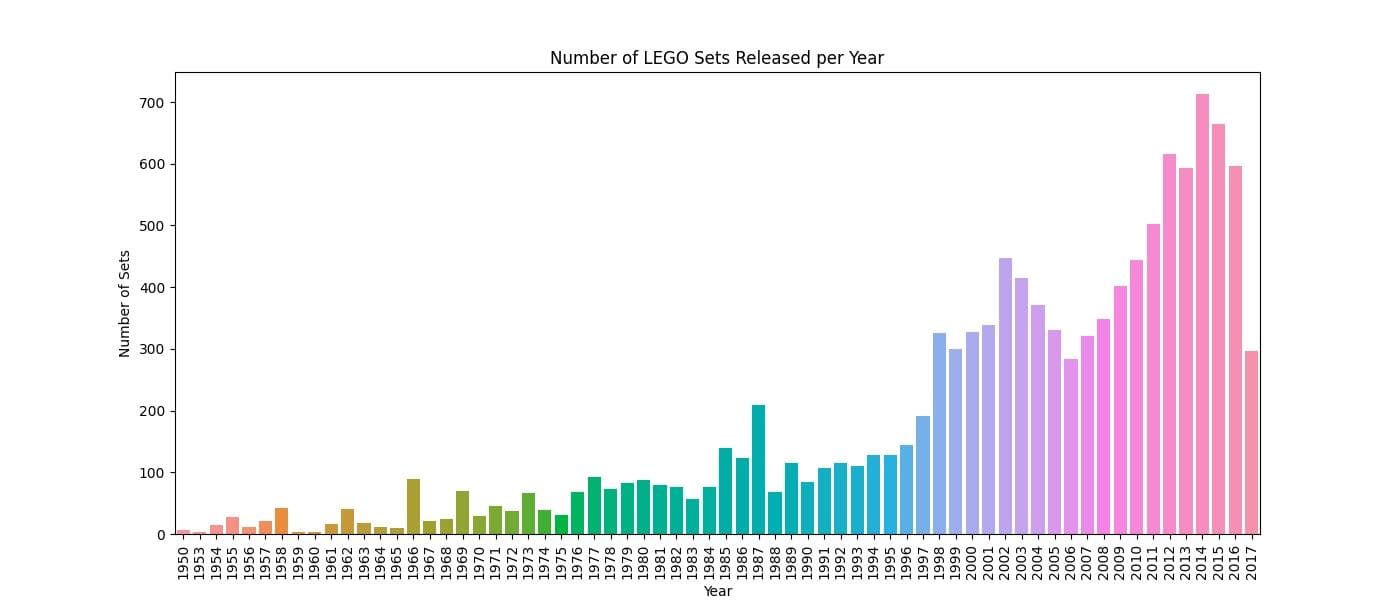
💡Side note: Apart from the drop off we see in 2017, which is probably because the dataset only covers up until July of that year, it’s quite evident from this chart that LEGO is now producing more sets than in decades past, which is great news.
Next, we’ll connect this to another resource query, this time for an S3 bucket.
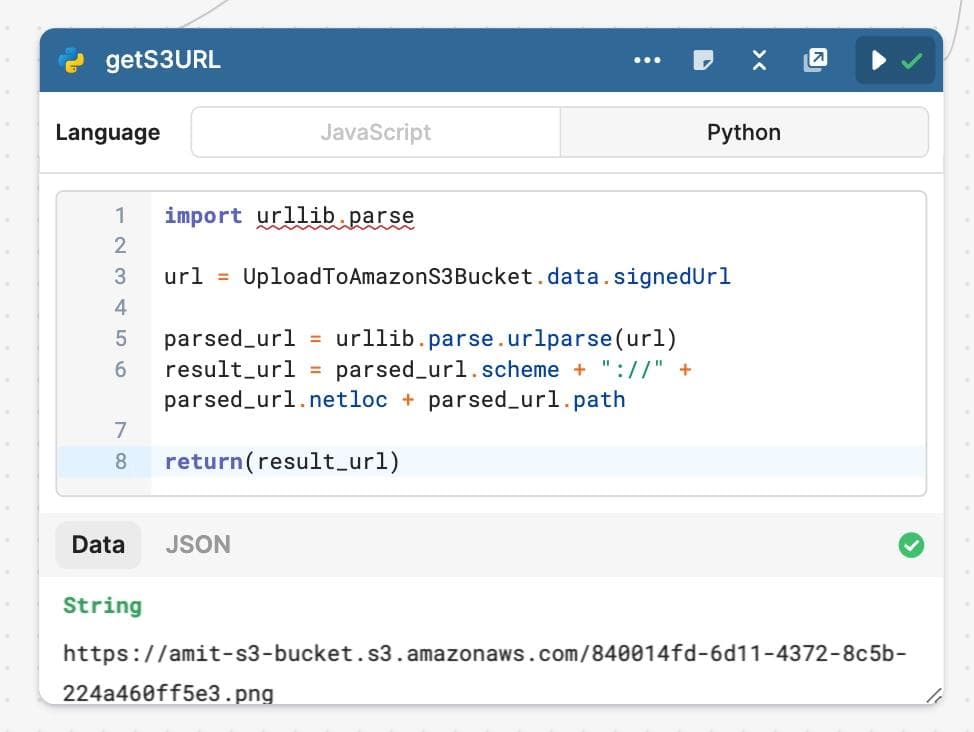
To make it easier to reference the URL in our email, we’ll add another little Python code block to clean up the S3 URL, and we’ll grab the link to our file.
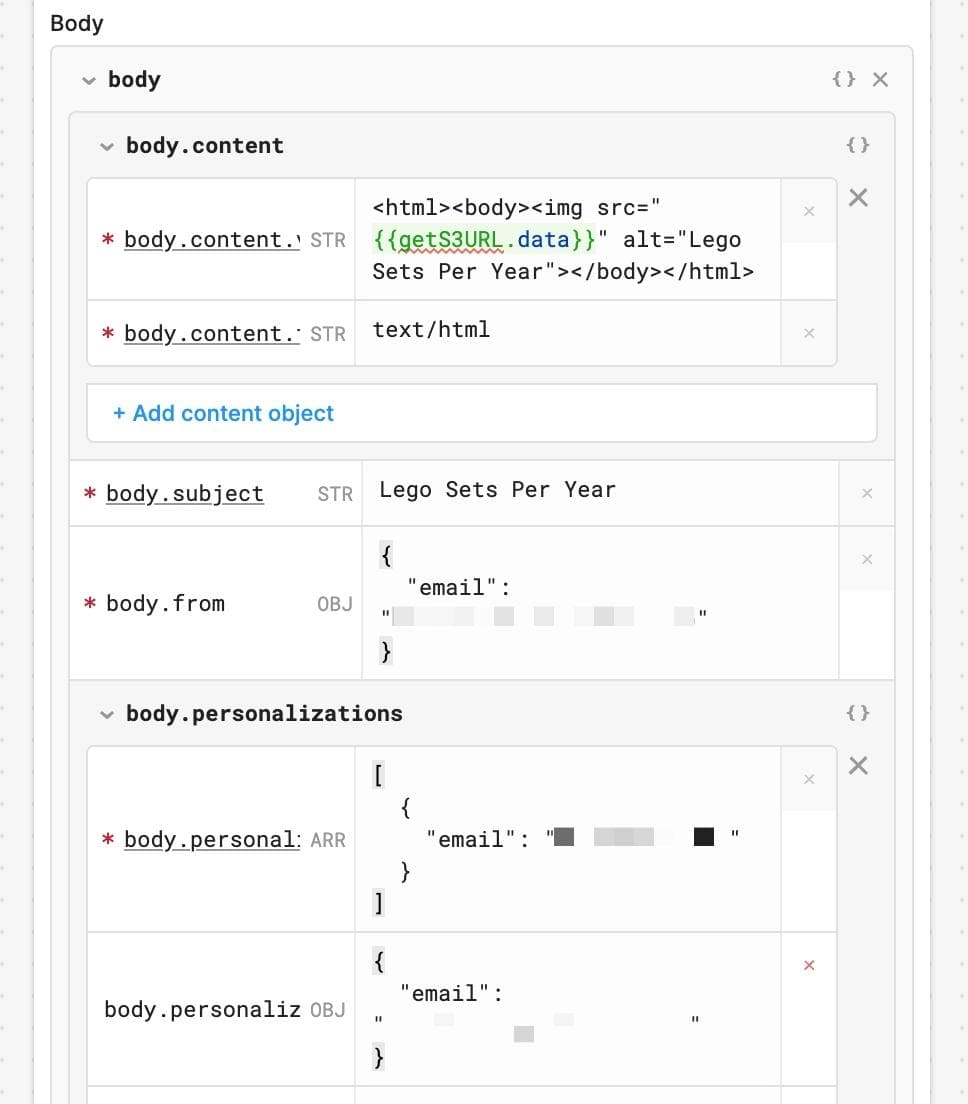
Finally, we’ll reference that URL in our SendGrid email block.
Here’s what the final workflow looks like:
Now that we have the workflow setup, we can test it by clicking on the “Run” button at the top. This will manually run the entire workflow, so you can test if it’s functioning correctly. Once you’re satisfied, you can enable and deploy it, so it will fire off using the settings in the StartTrigger block.
We can follow the same process using this code to get the average number of pieces per LEGO set over the years.
1 2 3 4 5 6 7 8 9 10 11 12 13 14 15 16 17 18 19 20 21 22 23 24 25 26 27 28 29 30 31 32 33 34 35 36import pandas as pd import seaborn as sns import matplotlib.pyplot as plt import io # create a pandas dataframe called lego_sets using the lego set data retrieved in the previous block lego_sets = pd.DataFrame(getLegoSetsData.data) # group the dataset by year and calculate the mean of pieces per set for each year pieces_per_set_per_year = lego_sets.groupby('year')['num_parts'].mean().reset_index() # create a line plot of pieces per set over the years plt.figure(figsize=(14, 6)) # set the figure size sns.lineplot(x="year", y="num_parts", data=pieces_per_set_per_year) # set the x and y axis, and the data for the plot # add title and labels to the plot plt.title("Average Number of Pieces per Set over the Years") plt.xlabel("Year") plt.ylabel("Average Number of Pieces per Set") # rotate x-axis labels for better readability plt.xticks(rotation=90) # display the plot plt.show() # save the plot as a PNG image in a file buffer file_buffer = io.BytesIO() plt.savefig(file_buffer, format='png') file_buffer.seek(0) # get the image data from the file buffer image_data = file_buffer.getvalue() # return the image data return image_data
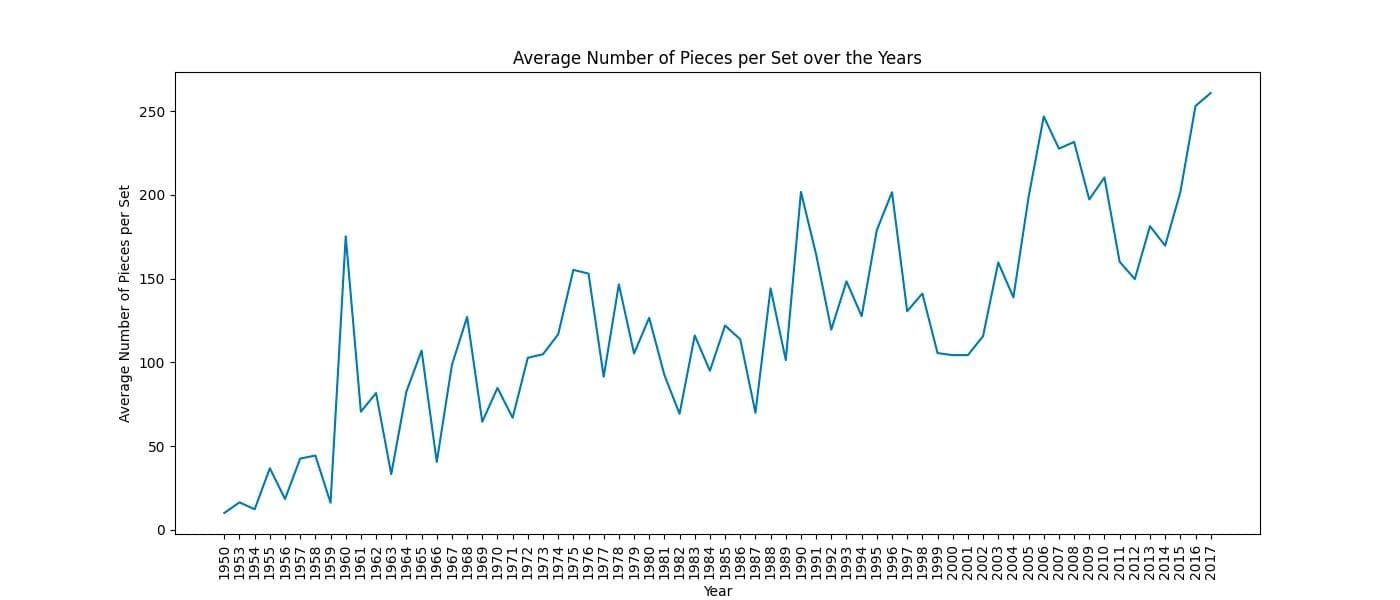
We can see from this chart that the sets are becoming larger on average. More LEGOs!
🧱Fun Fact: As of 2021 the largest LEGO set in terms of the number of pieces is the LEGO Art World Map set, which contains 11,695 pieces.
To wrap up, with Retool Workflows’ support for Python, we were able to analyze a LEGO dataset using popular Python libraries like pandas, seaborn, and matplotlib to create visualizations that helped us gather some pretty interesting insights.
The libraries we used in this post are only the tip of the iceberg. Retool comes pre-installed with over 20 popular Python libraries and packages, including openai, beautifulsoup4, and pillow, making it a powerful tool for any data science project.
You can download the JSON for these workflows here: Workflow 1: Number of sets produced over the years, and Workflow 2: Average number of pieces per LEGO set over the years), and import it into your Retool account.
I hope you found this post helpful in demonstrating how to use Retool Workflows to automate your data analysis projects. Questions, comments, or favorite LEGO sets? Feel free to reach out to me on Twitter.
P.S. My favorite LEGO set is the Seinfeld set—it has a total of 1,326 pieces!
Reader