

Today we’re excited to launch Debug Tools, a faster way for developers to investigate and debug errors in their Retool apps.
Debug Tools are now available for all cloud users, and will be available in the next on-premise version.
When your Retool apps experience errors, you need all of the details to identify and solve the issues. Debug Tools are a set of features that give you more visibility so you can diagnose and fix these errors faster.
Our Debug Tools are designed to be immediately familiar to any developer. They’re like Chrome DevTools for Retool: you can trace the flow of data, identify dependencies between components and code, and reproduce errors in the end-user experience. They also give you the most visibility offered by any app development platform, helping you build more complex and performant apps faster.
Only editors and admins can open Debug Tools by clicking the bug icon on the right of the status bar at the bottom of every Retool app, or by using the CTRL+` keyboard shortcut. You will see Debug Tools alongside information around environments, releases, query status, and history when you’re in edit or preview mode. The status bar is not shown to end users.

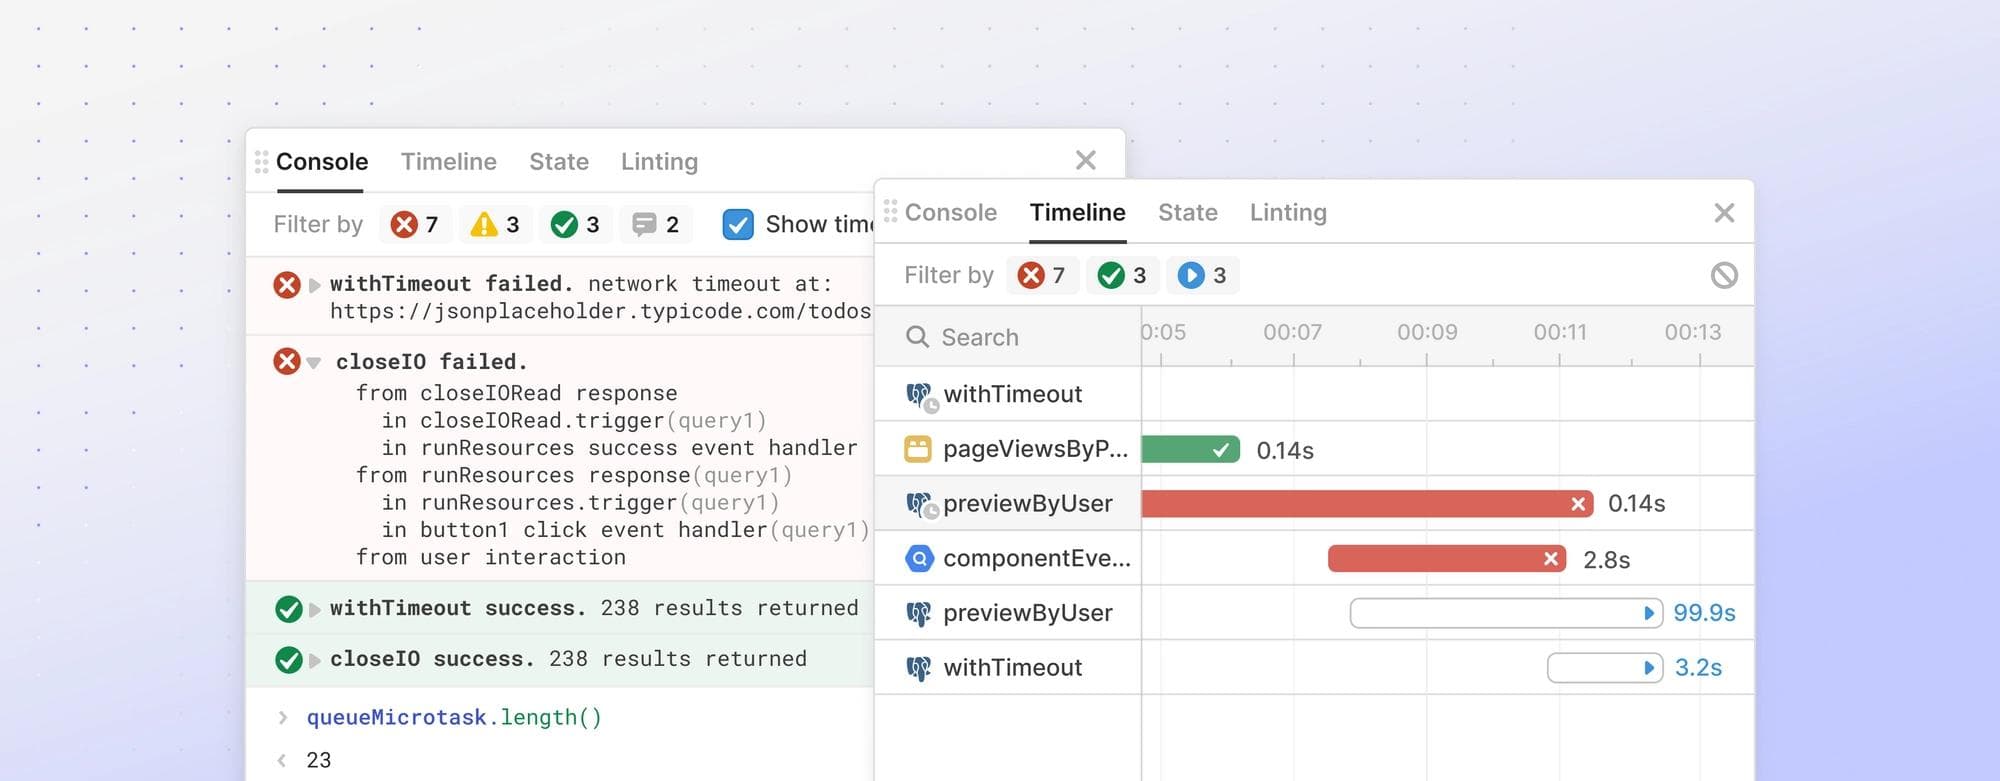
Get notified every time there’s an error. Every error is logged to the console and includes a stack trace that makes it easy to investigate why a query was triggered, how long it ran for, and what its inputs were. No errors will fail silently.
Quickly understand the error. Dive deeper into an error in the Console tab, which displays a running log of errors, warnings, and success messages from your components and code. Every log includes a stack trace that shows the full chain of events that led to a particular message, each with a link to the related component or code.
You can also run JavaScript from the Console’s command line, allowing you to quickly inspect any property in your app (e.g., `textInput1.value`) or run API methods (e.g., `query1.trigger()`).

Follow the flow of data in your apps. See a timeline of events to help you debug parallel queries and visualize query sequencing. The Timeline tab shows a live view of all query runs, making it easier to see run times and quickly identify successful, failed, and active query runs.

Inspect the state of all properties including dependencies. The State tab enables you to see why queries were triggered. You can see the current state of all properties in your apps, as well as see dependencies between individual properties and calls from event handlers or JavaScript. This makes it easy to see everything that triggers a specific query. You can also jump to what you need with a “View state” context menu action and built-in search.

Get deeper insights into JavaScript errors. The Linting tab displays JavaScript errors like undefined variables and invalid JavaScript syntax. You can select any error to jump directly to the related code.
Early customers have been using Debug Tools to update and ship apps more confidently. One user, Dominic James-Moore, shares “With Debug Tools, I can quickly diagnose errors without having to go into edit mode, and debug parallel queries with the timeline view. It’s not easy to build a development environment in the browser, but Retool’s engineering really is first-class.”
Debug Tools are now available to all cloud customers, and will be available in the next on-premise version. Check out our docs to learn more, and feel free to send any feedback to jessicasun@retool.com. We’re excited to make debugging your apps quicker and easier than ever before.