
In 2020, ThePowerMBA was named the Best Spanish Startup by LinkedIn. A new type of business school, the company lets users learn directly from industry leaders in 15-minute video classes. “It’s highly practical and relevant, and offers users access to the world’s best, for a minimal investment of time and money,” says Gonzalo Plaza, the company’s Data Lead.
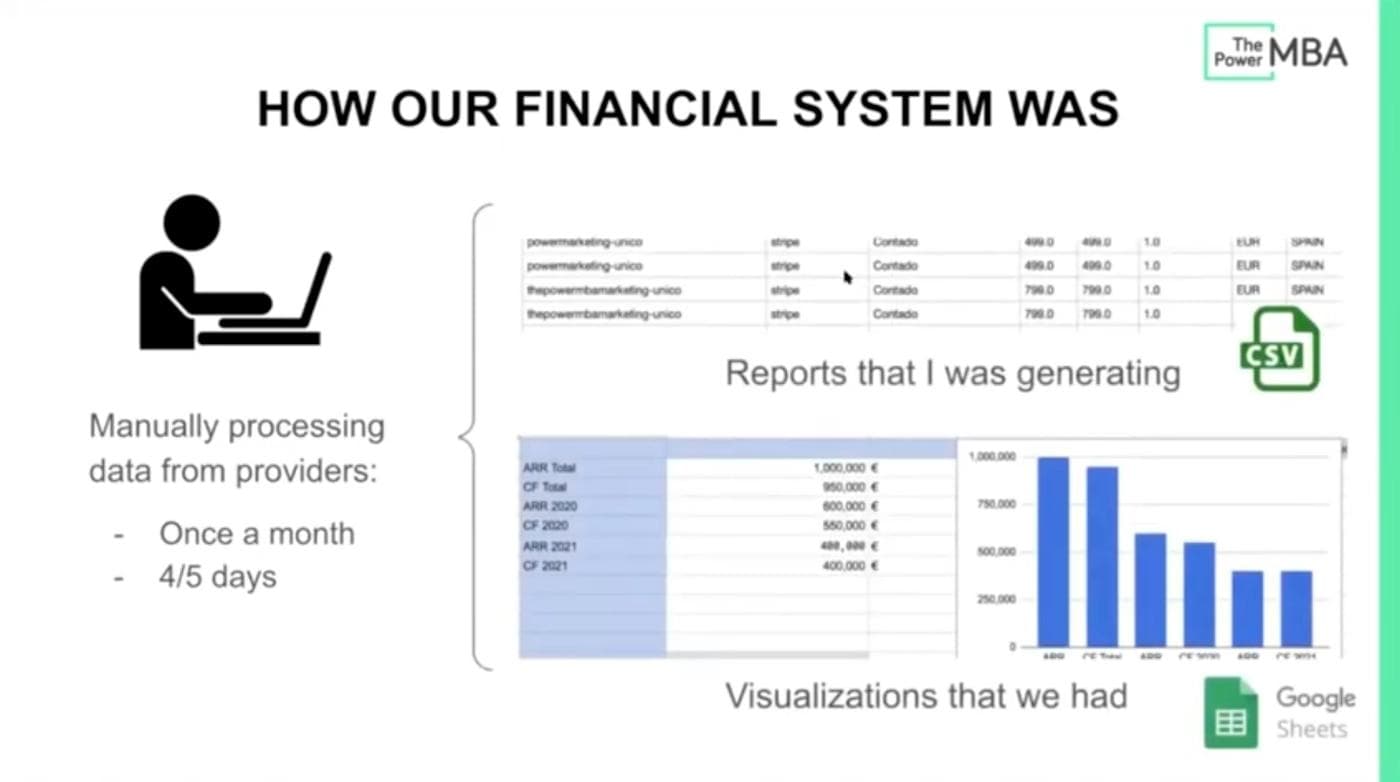
As they've grown incredibly fast, a lot of their internal systems have become outdated very quickly—for example, their financial system. Every month, they would manually process data from their providers, reviewing revenue and all payments received from different sources (like PayPal and Stripe).
The whole process took 4 to 5 days to complete, during which Gonzalo would generate a CSV, upload it to Google Sheets, and create visualizations from the spreadsheet. It was a time consuming process, very manual and prone to errors, and didn’t give Gonzalo or any member of the company an accurate picture on the health of the business in real-time.
“The way we were managing our financial reporting was just not an option in the long term or in the face of our rapid growth,” he says.
So the development team created a payment gateway to integrate more than 20 payment providers, sending the orders to MongoDB—but he still faced one problem: “I wasn’t able to show visualization of revenue to our team.” For that, he turned to Retool.
Today, Gonzalo and his team use Retool for reporting and visualizing financial data. He connected the data from ThePowerMBA’s MongoDB database to Retool in order to show real time analytics and visualizations on a dashboard.
Using the dashboard, team members can now see all orders for courses on ThePowerMBA in one place and revenue data reflects real-time, accurate information. What’s more, they can filter the information based on time frames, specific courses, and customer email addresses.
Getting granular with the data helps them understand the financial information in more detail. The dashboard also allows them to aggregate data, showing an overview of monthly revenue, cashflow, and programs they’ve sold.
Using the old system, they could only see one month at a time—now they’re able to see past months alongside the current month to compare and contrast. They’re also able to filter by different parameters, such as where the purchase of a course was completed.
For visualizations—one of the main reasons Gonzalo decided to adopt Retool—he created several tables to show the financial status of the company at any point in time.
Using these tables allows the team to make data-driven decisions by comparing year over year revenue at a glance, seeing an active cashflow chart, aggregating revenue, and identifying trends.
Using filters on visualizations, they can see revenue segmented for different parameters like time, region, and payment provider to drill deeper into the data and inform strategy for other parts of the organization, such as marketing.
And Gonzalo didn’t stop with the financial dashboard. He also built a sales tool in Retool that instantly generates custom links for customers to buy their courses. Sales people can use a simple drop down module to create a code for a customer they’ve been talking to—with one click.
Using their old financial reporting process took Gonzalo over 40 hours each month and was error prone because everything happened manually. And because it was only done once each month, ThePowerMBA team couldn’t get real-time analytics.
Now, using Retool, the dashboard instantly generates reports on an ongoing basis that are accurate and up to date—no more errors from manual data processing. Everyone at the company can see the dashboard for real-time analytics that are used to make informed, data-driven decisions.
Gonzalo hopes to further improve ThePowerMBA’s financial reporting dashboard by integrating marketing data so that the impact of marketing campaigns can be measured as they happen. He’d also like to help other departments by building useful tools for them.
He adds, “my hope is for the entire organization to become more data-driven so that we can continue to grow ThePowerMBA at an even faster rate and better serve our customers.”
Want to hear even more details from Gonzalo directly? Check out his lightning demo where he walks through all of his favorite apps here.
Reader