Application Performance Dashboard
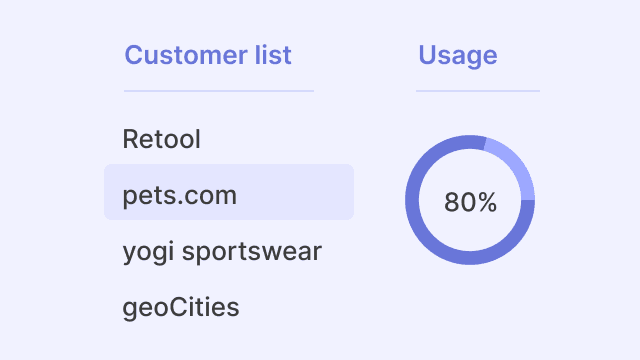
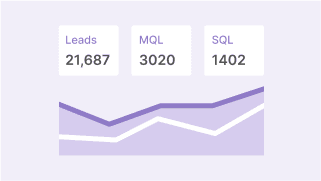
An application performance dashboard provides a comprehensive view of your application's performance metrics based on a specific dataset.
How it works
Retool generates production-ready AI apps. You can start with a prompt, then connect to real databases and APIs, apply enterprise security, and deploy in your cloud.
Learn more about Retool AI app building- Click the "Generate this app in Retool" button above to start building with a prompt
- Retool generates an app you can actually operate, not just a demo: UI, logic, and editable components
- Connect securely to your databases, third-party services, and any REST or GraphQL API
- Ship with enterprise controls: SSO, role-based access, approvals, and audit logging
- Deploy and iterate over time in Retool Cloud or your own VPC
Build Dashboard apps with AI
Build Engineering apps with AI
Build other apps with AI


Customers using Retool like this
View customer stories“Investing in internal tools used to be a difficult and polarizing trade-off; Retool helped us to shift that paradigm by making tools a quick and painless part of any project, saving us countless hours of operator and engineering time.
Investing in internal tools used to be a difficult and polarizing trade-off; Retool helped us to shift that paradigm by making tools a quick and painless part of any project, saving us countless hours of operator and engineering time.
Rohan Chopra
Director of Engineering at Doordash
“Instead of months, we launched a Retool app in two weeks because our developers didn't have to build out a frontend repo with custom UI.
Instead of months, we launched a Retool app in two weeks because our developers didn't have to build out a frontend repo with custom UI.
Paula Obler
Software Engineer at Earnin
Frequently Asked Questions
Retool is a development platform that allows developers to quickly build custom internal tools and dashboards for their businesses. Retool offers a drag-and-drop interface and pre-built components, making it easy to create applications while writing little code.
Retool is used by a variety of businesses, from small startups to large enterprises, across industries such as healthcare, finance, and e-commerce. Retool is particularly useful for businesses that rely heavily on internal tools and dashboards to run their operations, as it allows for the creation of custom applications tailored to their specific needs.
Retool supports a wide range of databases, including MySQL, PostgreSQL, Microsoft SQL Server, Amazon Redshift, and Google BigQuery. Retool also offers integrations with popular APIs and services such as Stripe, Twilio, and Slack, making it easy to incorporate data from these sources into Retool applications. Here is a list of all our different integrations.
Supercharge your business today.
Start building an internal tool or customer portal in under 10 minutes.
Social Media Monitoring Dashboard
This app offers a comprehensive social media monitoring dashboard to track, analyze, and manage social media activities. Monitor mentions, analyze engagement, and make data-driven decisions for effective social media strategies.