Database Monitoring Dashboard
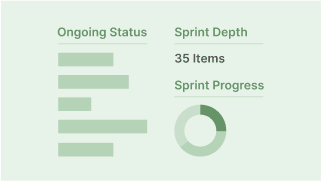
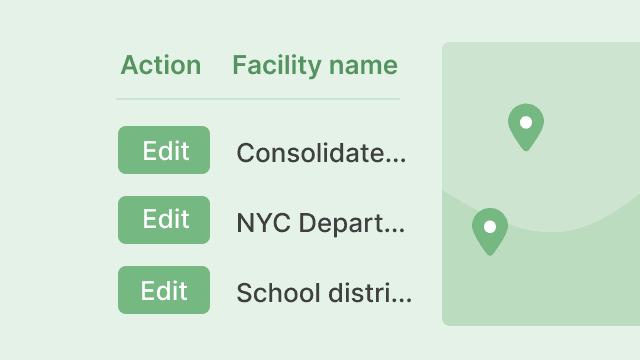
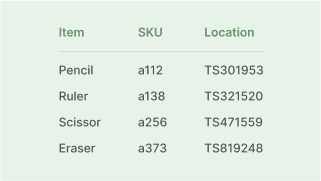
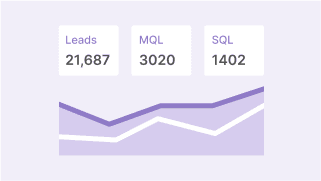
This database monitoring dashboard allows you to monitor and manage your datasets, providing a clear and organized view of each data row.
How this template works
Retool allows you to bring your data to life to make powerful internal tools with both pre-made and custom components.
Learn about how Retool works- Click 'Try this template' to import this template and create an organization.
- Edit your generated application visually by dragging-and-dropping components and writing queries against your pre-populated Retool Database.
- Extend this application by connecting to your own database to start building powerful internal tools.
Explore more Dashboard templates

Explore more Engineering templates
Explore other templates

Customers using Retool like this
View customer stories“Retool lets our engineers move significantly faster and focus on customer-facing features. We build lots of tools for both support and success in Retool, all of which are used daily. It's one of my favorite pieces of software!
Retool lets our engineers move significantly faster and focus on customer-facing features. We build lots of tools for both support and success in Retool, all of which are used daily. It's one of my favorite pieces of software!
Ismail Ceylan
Co-founder, Software Engineer at Zeplin
“Using Retool, we've built internal tools for our retail and merchandising teams quickly, while maintaining our speed on feature development for our shoppers.
Using Retool, we've built internal tools for our retail and merchandising teams quickly, while maintaining our speed on feature development for our shoppers.
Eddy Kim
Engineering Manager at Verishop
Frequently Asked Questions
Retool is a development platform that allows developers to quickly build custom internal tools and dashboards for their businesses. Retool offers a drag-and-drop interface and pre-built components, making it easy to create applications while writing little code.
Retool is used by a variety of businesses, from small startups to large enterprises, across industries such as healthcare, finance, and e-commerce. Retool is particularly useful for businesses that rely heavily on internal tools and dashboards to run their operations, as it allows for the creation of custom applications tailored to their specific needs.
Retool supports a wide range of databases, including MySQL, PostgreSQL, Microsoft SQL Server, Amazon Redshift, and Google BigQuery. Retool also offers integrations with popular APIs and services such as Stripe, Twilio, and Slack, making it easy to incorporate data from these sources into Retool applications. Here is a list of all our different integrations.
Supercharge your business today.
Start building an internal tool or customer portal in under 10 minutes.