SLA dashboard
Hold your team accountable with visibility into support metrics like time to response.
Industry
End users
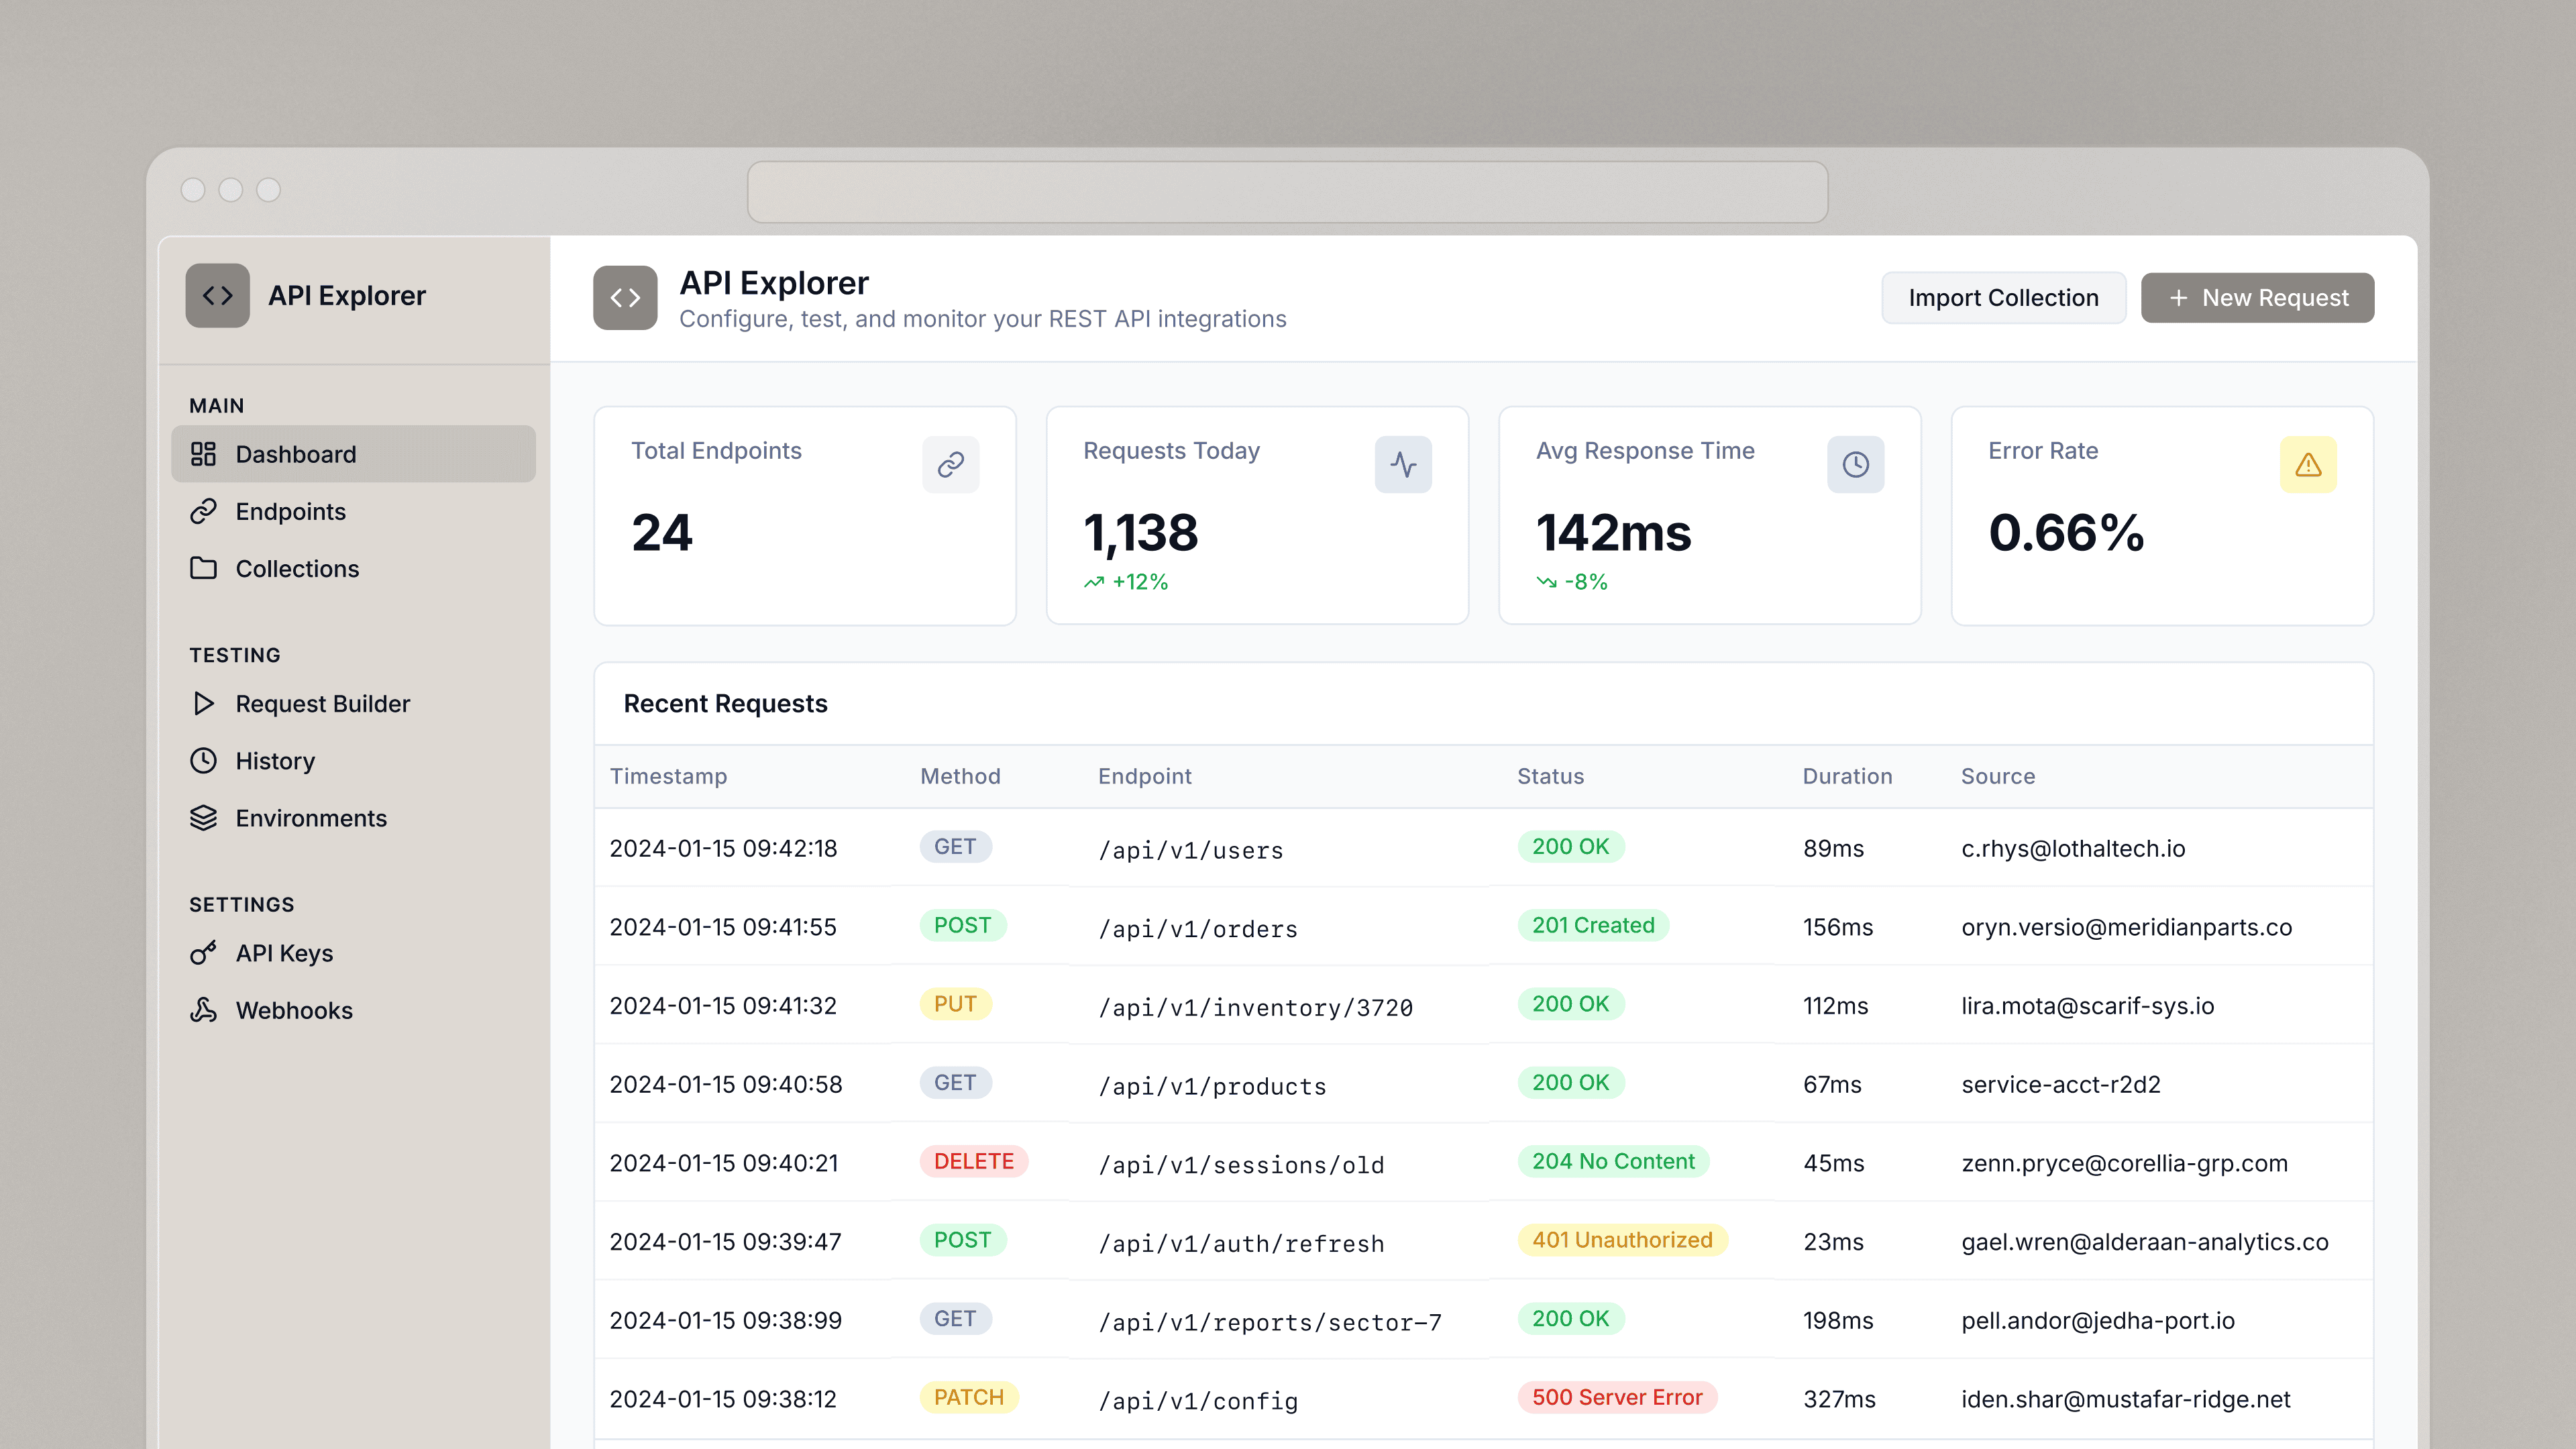
Build on your own data
Retool connects to your databases, third-party services, and anything with a REST or GraphQL API. Describe the app you want and AppGen builds it against your real data — with your organization's SSO, permissions, and audit logging already applied. Browse the integration library to see everything Retool connects to.
 1. Connect your data
 2. Query it
 3. Build the UI
From startups to Fortune 500s, the world's most effective teams use Retool to build custom business software. See our customers.







“Retool has enabled us to completely remodel and refine our systems, which in turn has freed up valuable engineering resources equivalent to 2-3 full stack engineers.
Retool has enabled us to completely remodel and refine our systems, which in turn has freed up valuable engineering resources equivalent to 2-3 full stack engineers.
Adam Louie
Senior Director of Business Operations at LeadGenius