
Apps are bound to break. It's not because of the developer’s skills or even the application’s integrity—it's the nature of software. APIs change, data structures evolve, and business needs shift. The real challenge isn't avoiding every possible error. It's detecting, diagnosing, and fixing errors before they impact business operations.
For large enterprises maintaining mission-critical applications, comprehensive visibility is not negotiable. Robust error monitoring gives teams immediate insight into application health. Knowing what they're up against allows them to address issues that impact users. Instead of sifting through logs or making educated guesses about the error's source, developers can pinpoint exact failure points, understand root causes, and install targeted fixes.
Applications built with proper observability safeguards become reliable business assets. Each detected error becomes an opportunity to strengthen architecture and reduce tech debt. With proper error monitoring, development teams can stop the constant firefighting and build apps with the stability and reliability that enterprise users demand.
Building reliable applications starts with total visibility—captured logs, stack traces, and metrics. Teams catching and fixing errors aren’t the only ones affected. Internal partners and customers rely on speedy error resolution to keep operations running. That's why we've built error monitoring right into Enterprise applications.
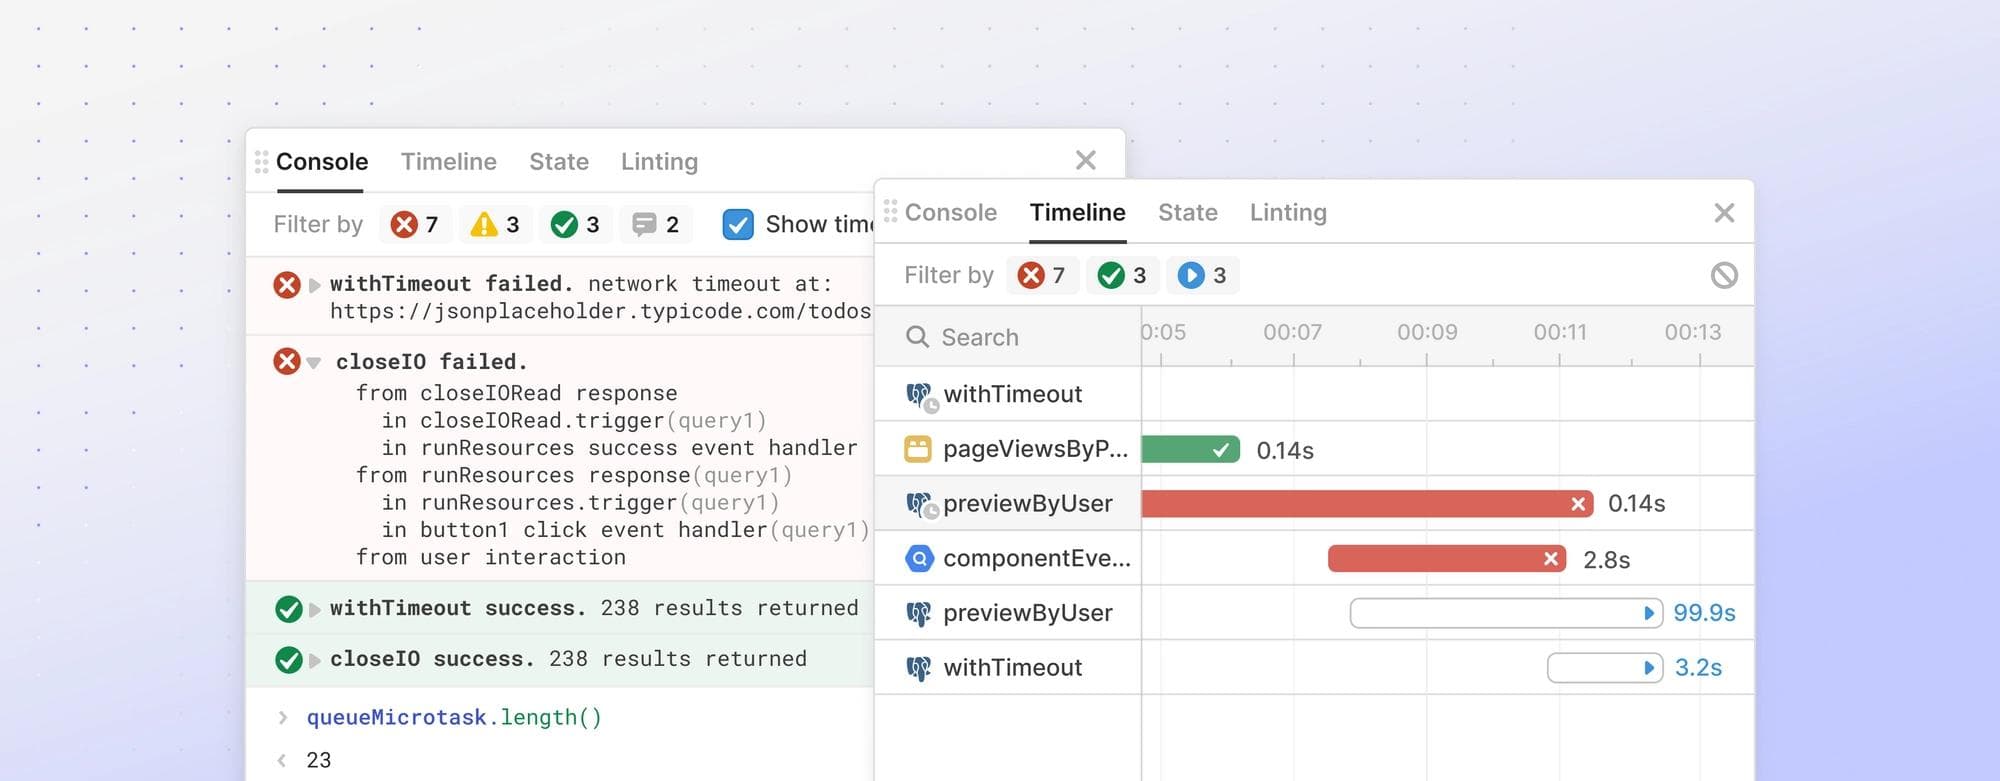
Live apps automatically capture comprehensive error information, including:
- Detailed stack traces
- Error type
- Error tags
- App state
Error monitoring streams this info into your Datadog or Sentry instance. It also captures critical failure points like:
- Resource misconfigurations
- Failed queries
- Component rendering errors
- Authentication issues
Your team can rest easy knowing that error monitoring captures, categorizes, and flags each of these (and more!) automatically.
Customers using Retool’s error monitoring saw a 15% drop in errors within 5 weeks.

We natively support Datadog and Sentry, but you can also use other observability providers. Start by implementing custom error monitoring using Retool Events.
You can also create custom workflows that route errors to any observability platform in your stack—whether it's Splunk, New Relic, Dynatrace, or your internal systems. You can connect to your existing tools and monitor all of your apps without any disruption.

Performance monitoring is next in our observability suite. It'll give deeper insights into what’s slowing your apps down
Whether it’s an overloaded database query or an inefficient frontend process, teams can send detailed traces to any provider to pinpoint exactly where delays occur using OpenTelemetry. This means smoother experiences for end users, faster debugging cycles, and, ultimately, more performant applications. Stay tuned as we roll this out!
Error monitoring is available as part of the Enterprise plan on versions 3.114 and above. If you’re ready to provide your team with the observability tools they need, check out our docs to get started today.
If you haven’t upgraded to version 3.114+, check out our upgrading best practices guide.